In this article you will learn:
- What the most common types of charts are
- How to read a Japanese Candlestick chart
- What timeframe to choose to understand market movements better and make more realistic forecasts.
Types of charts
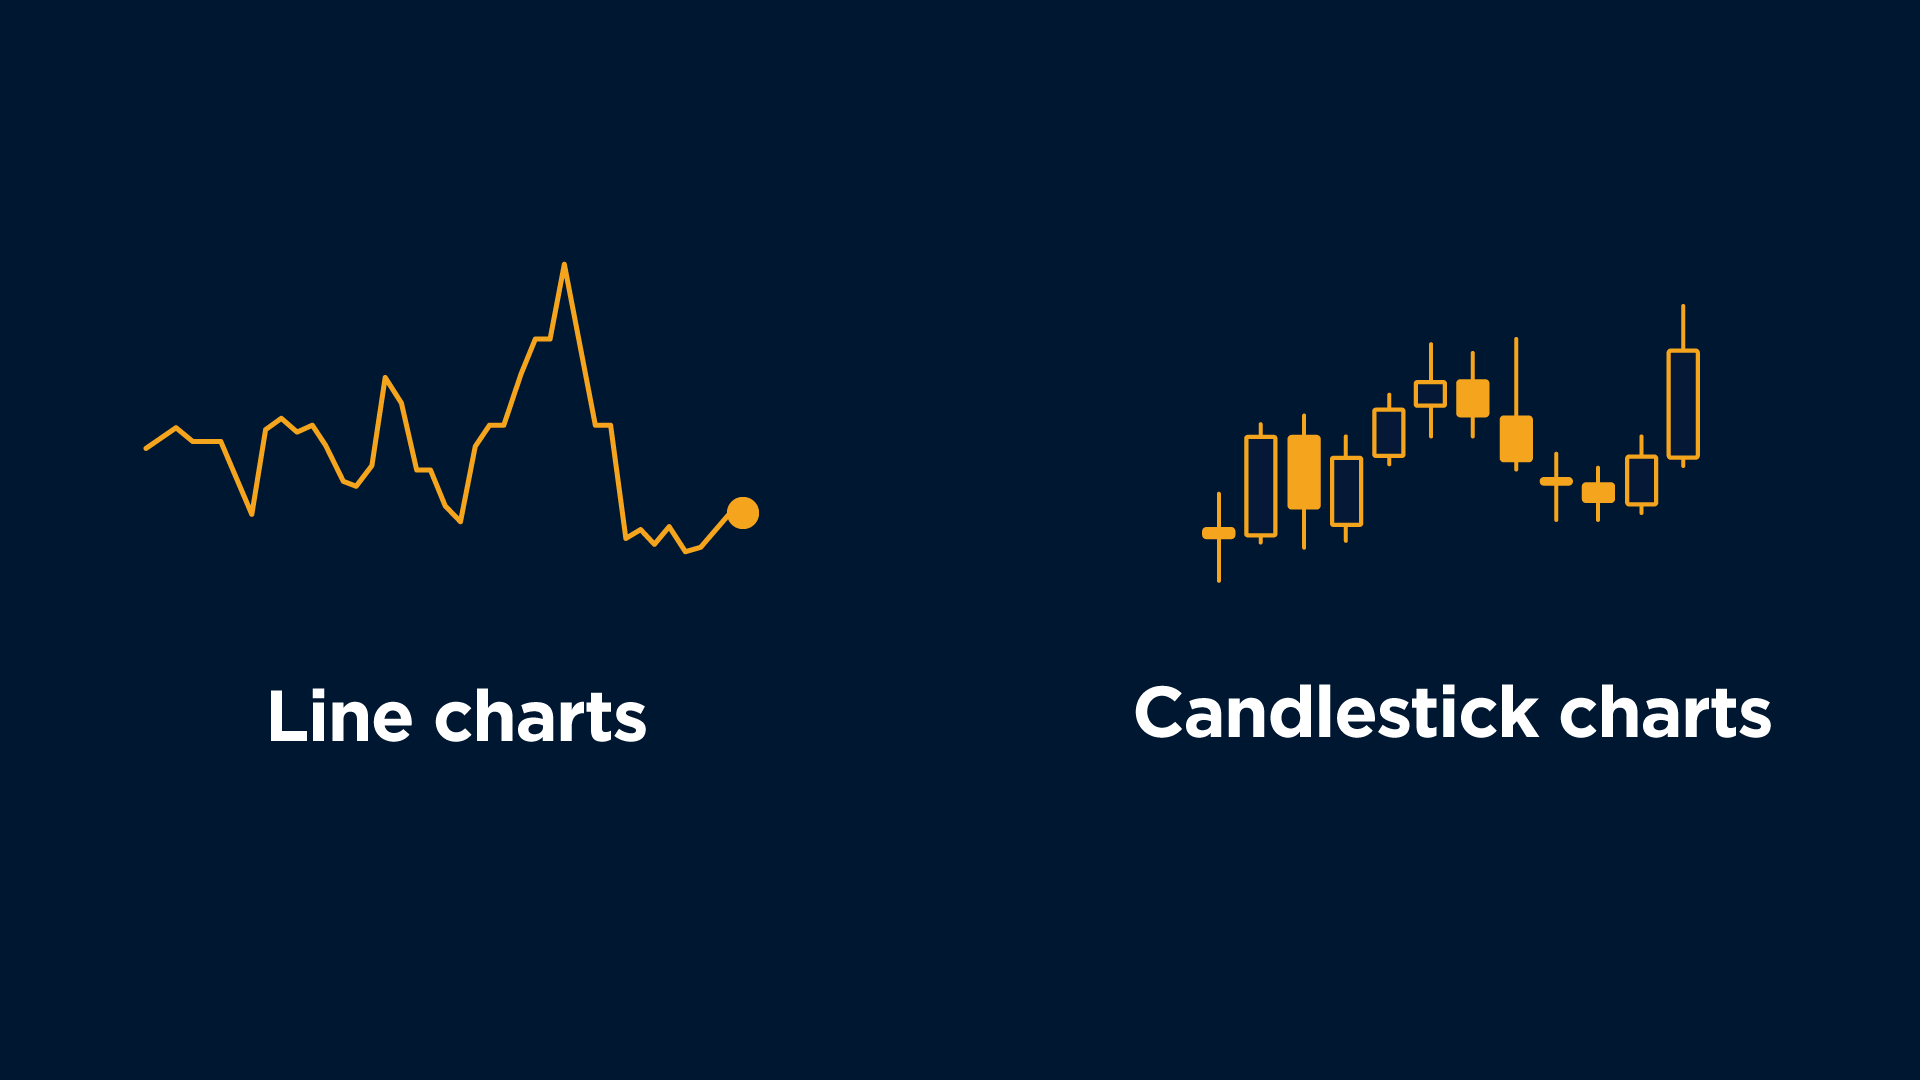
There are two basic types of charts available in Forex: Line and Japanese Candlestick. Let’s look closer at both of them.
Line charts
Line Charts are the simplest, as they only connect closing prices over a given time period and depict the general price trend.
You can use this type of chart as an overlay or for comparing charts when performing an inter-market analysis.
For example, you might compare the prices of the Australian dollar and gold using a line chart.
Candle charts
Japanese Candlesticks offer the most popular form of charting.
The candle chart bears much more information than the line chart and it is represented in an easy-to-grasp visual form.
The real body marks the area between the open and the close price. If price closes above the open, the body is hollow. If the price ends up closing lower, the body is solid.
The hollow candle is referred to as white, and the solid candle is called black, though, in reality, the chart can be shown in any color.
The narrow line - called a shadow - shows the price range for the set time period.
One Japanese candlestick is basically a linear chart representing a price for a selected timeframe but shown in a more compact form.
Take a look at how a linear chart that represents a growing price converts into a white Japanese five-minute candle.
Now, this is how a linear chart that represents a falling price converts into a black Japanese five-minute candle:
What timeframe to choose for the chart
Traders use monthly, weekly, daily, 4-hour, hourly, 15-minute and even 1-minute timeframes.
Ideally, traders pick the main timeframe they are interested in and then choose a longer and a shorter timeframe to complement the main one.
The longer timeframes typically contain fewer and more reliable signals. The shorter timeframes usually contain more signals with less accuracy.
There are several types of traders, and they have different trading styles.
Swing or position traders prefer holding trades for days or weeks.
They mainly focus on the daily charts for their trades. They can also make use of a weekly chart when defining the long-term trend, as you can see on the example. And track a 4-hour chart when defining the immediate short-term trend.
Intraday traders, who enter and exit the market the same day, pay more attention to shorter timeframes such as the hourly and 4-hour charts for entry signals, and the daily chart for the broader trend.

Summary
- You can use the line chart to make an intermarket analysis, but to analyze the price of the symbol you’re trading you should use the candle chart.
- The candles can be in two colors: white (bullish) where the closing price is higher than the opening price, and black (bearish) where the closing price is lower than the opening price.
- Use bigger timeframes to find strong support and resistance lines or a trend and smaller ones to make your final decision.
