USD/CAD Price Prediction: Breaks above key trendline after strong Canadian GDP data
- USD/CAD has broken above a key trendline and probably reversed trend.
- There is a possibility it could start trending higher if the break holds and prices move above 1.3520-25.
USD/CAD is decisively breaking above a key trendline for the downtrend it has been in since the start of August.
The break comes after the release of higher-than-expected Canadian GDP data strengthened the Canadian Dollar (CAD). It probably means the short-term downtrend is reversing, although more upside is required for confirmation.
USD/CAD 4-hour Chart
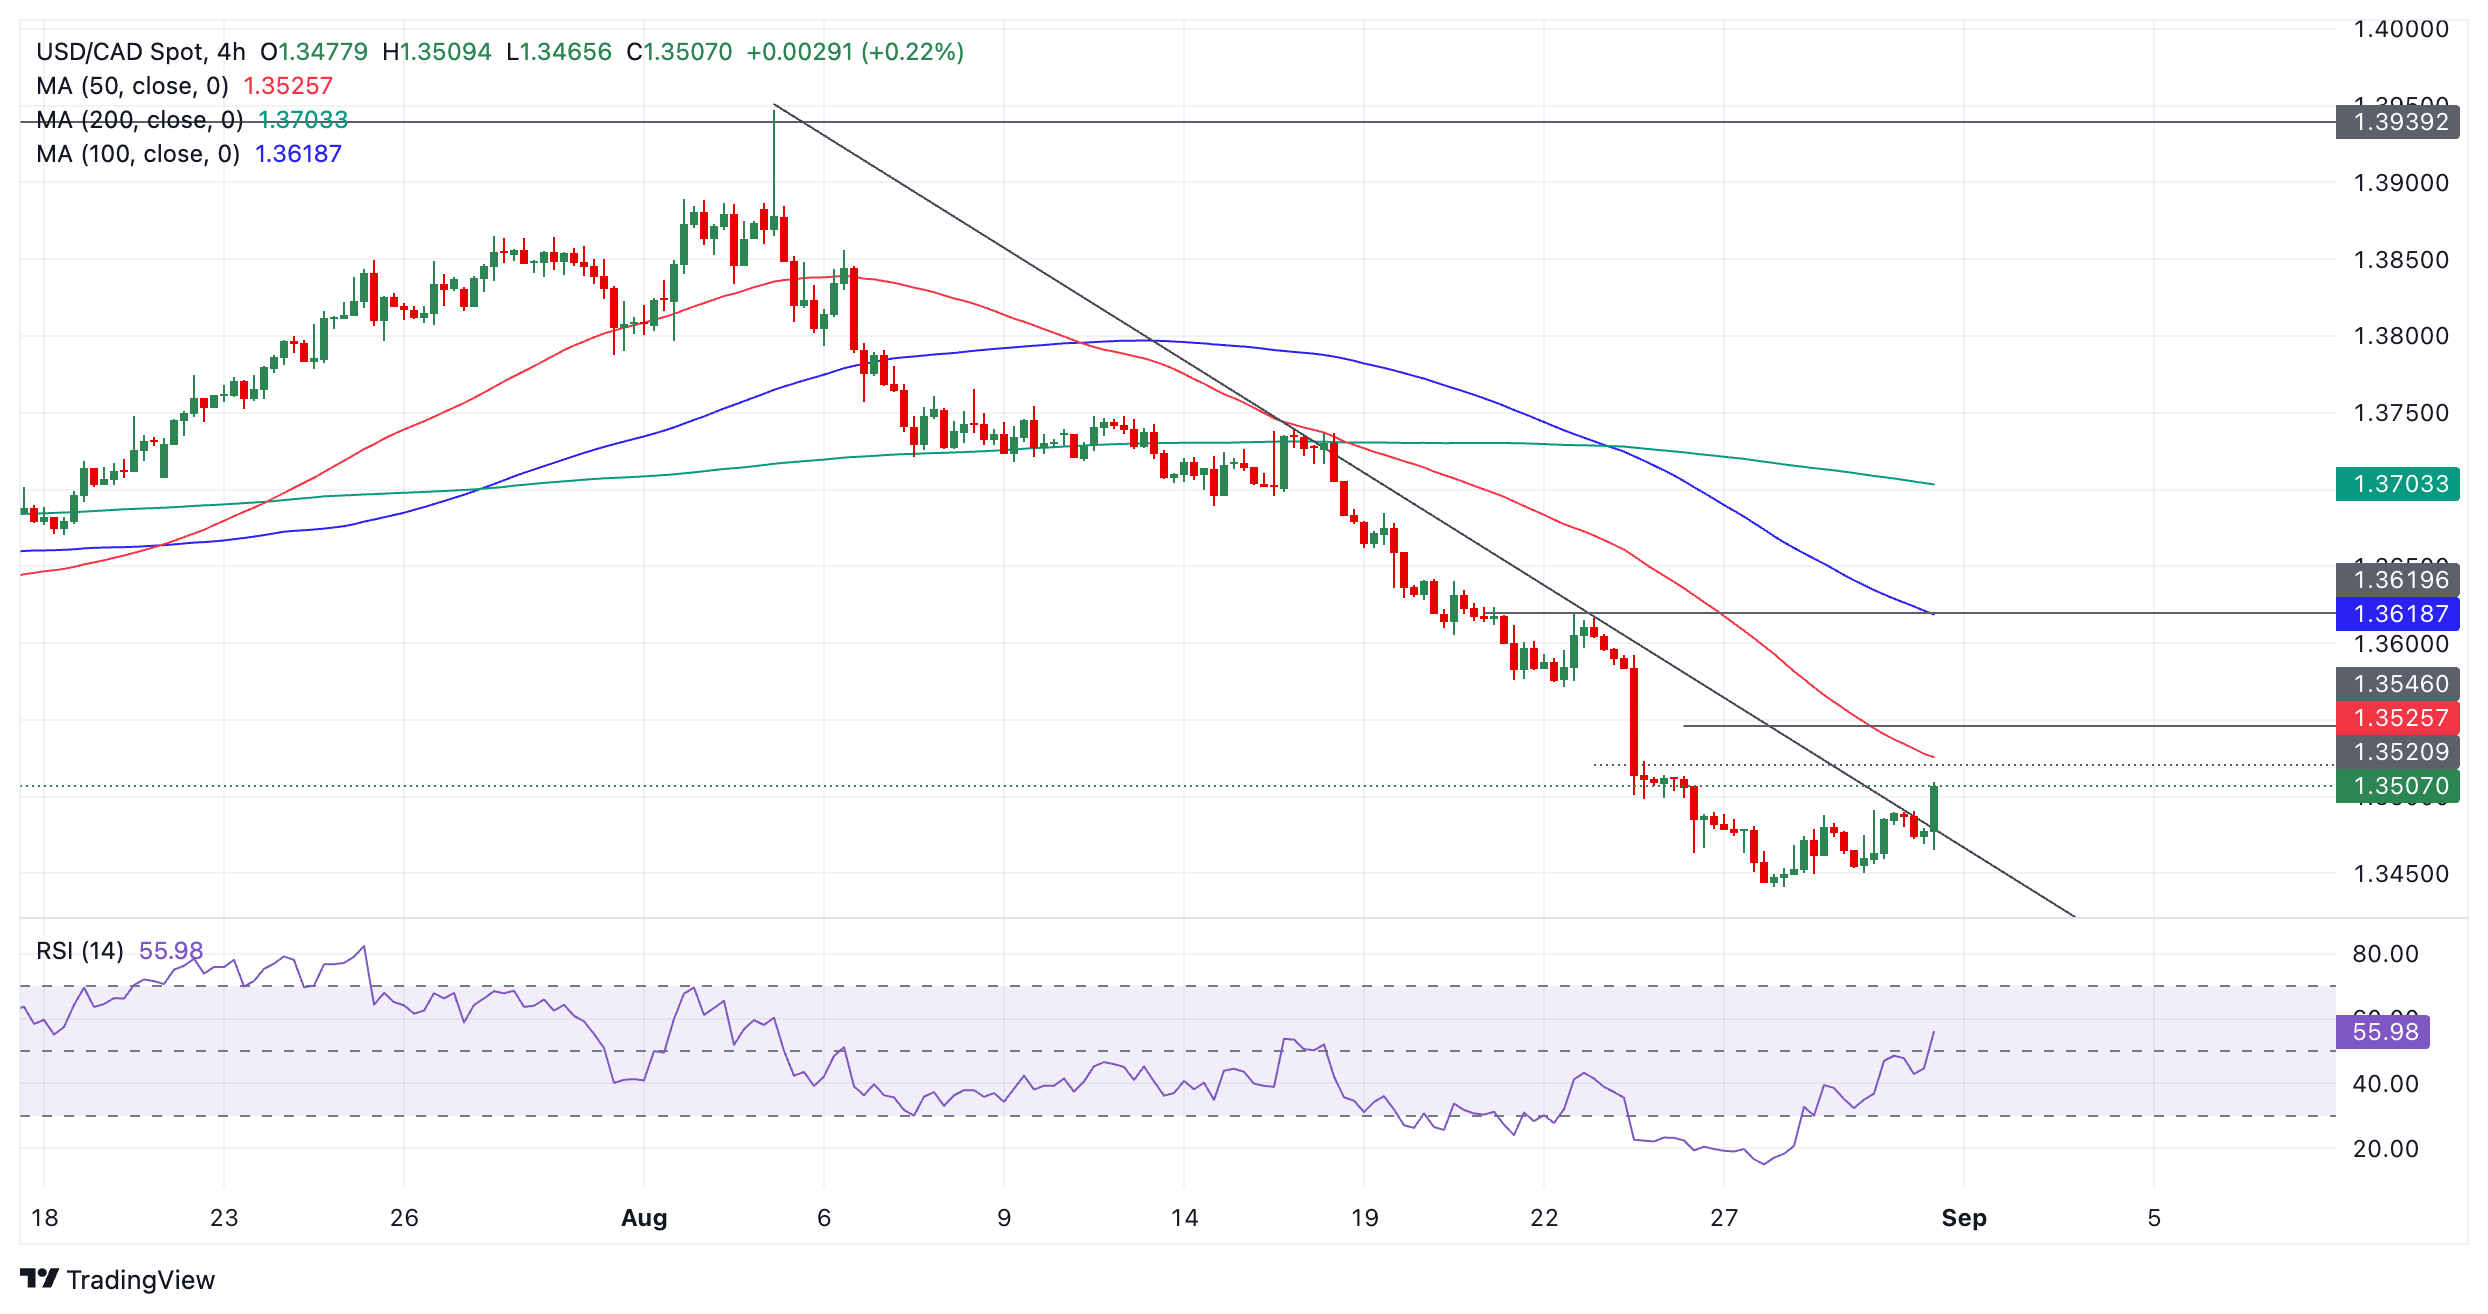
The trendline break was accompanied by a rise in the Relative Strength Index (RSI) momentum indicator out of its oversold zone, which provides a buy signal. This indicates either an extended correction higher is likely, or a complete reversal of the hitherto bear trend.
A close above 1.3520-25 and the trendline would bring into doubt the bearish bias and could indicate early signs of a reversal. Such a break could see the pair move up to 1.3593. A move above the latter would give a surer sign of a reversal of the trend.
If the break fails to hold and prices pull back down and close below the trend line, the bear trend might extend lower. The next bearish target is situated at 1.3380 – the swing lows of October 2023 and January 2024. This is followed by the bottom of the range at 1.3222.