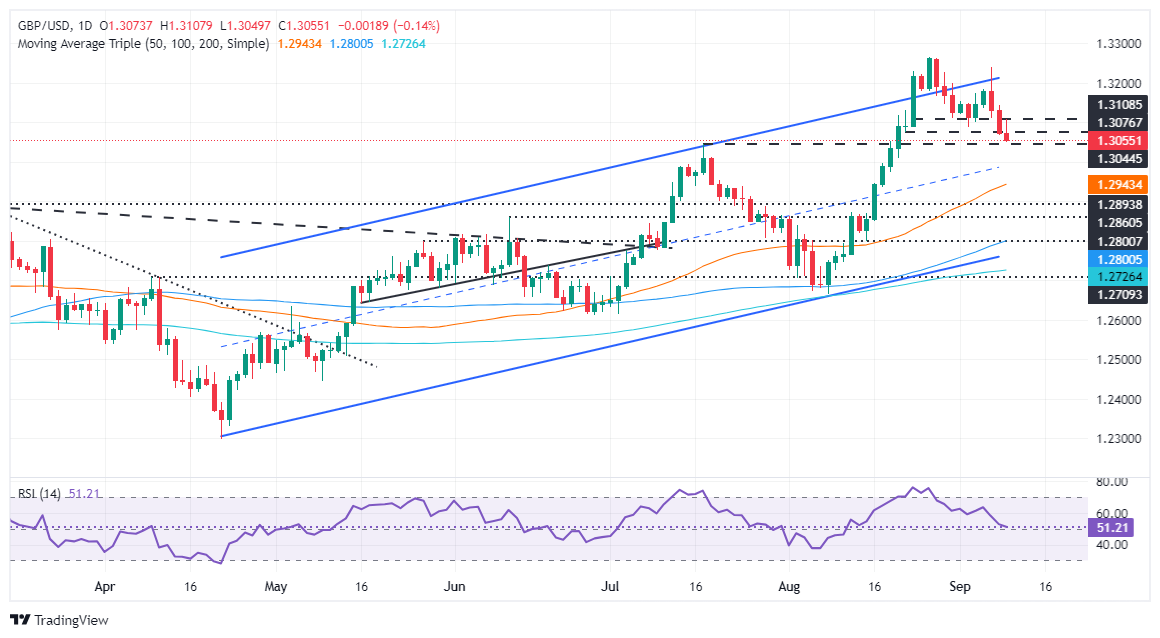
GBP/USD Price Forecast: Retreats below 1.3100 as traders eye key US CPI data
- GBP/USD slips towards key support at 1.3044, with momentum favoring further downside in the short term.
- RSI is turning bearish, signaling potential losses, with next support at 1.3000 and the 50-DMA at 1.2940.
- For buyers to regain control, GBP/USD must clear resistance at 1.3143 and push towards 1.3200.
The GBP/USD is on the backfoot after spiking to a daily high of 1.3107 after a solid UK jobs report, though it has retreated below the 1.31 handle as traders await the release of US inflation data. At the time of writing, the pair trades at 1.3052, down 0.17%
GBP/USD Price Forecast: Technical outlook
The GBP/USD fall toward the July 17 peak at 1.3044 could exert downward pressure on the pair and pave the way for further losses.
Momentum favors sellers in the short term. The Relative Strength Index (RSI) remains bullish, though its slope is aiming down and about to turn bearish, which could accelerate Sterling’s fall against the Greenback.
In that scenario, the GBP/USD path of least resistance is tilted to the downside. The first support would be 1.3044, followed by the psychological figure of 1.3000. A breach or the latter will expose the 50-day moving average (DMA) at 1.2940, ahead of the 1.2900 mark.
Conversely, if buyers would like to regain control, they must clear the September 9 high at 1.3143 before having the chance of challenging the 1.3200 figure.
GBP/USD Price Action – Daily Chart
British Pound PRICE Today
The table below shows the percentage change of British Pound (GBP) against listed major currencies today. British Pound was the strongest against the Canadian Dollar.
| USD | EUR | GBP | JPY | CAD | AUD | NZD | CHF | |
|---|---|---|---|---|---|---|---|---|
| USD | 0.14% | 0.14% | -0.40% | 0.35% | 0.24% | -0.03% | -0.23% | |
| EUR | -0.14% | 0.00% | -0.52% | 0.20% | 0.09% | -0.22% | -0.38% | |
| GBP | -0.14% | 0.00% | -0.52% | 0.17% | 0.11% | -0.21% | -0.36% | |
| JPY | 0.40% | 0.52% | 0.52% | 0.71% | 0.62% | 0.32% | 0.15% | |
| CAD | -0.35% | -0.20% | -0.17% | -0.71% | -0.12% | -0.38% | -0.56% | |
| AUD | -0.24% | -0.09% | -0.11% | -0.62% | 0.12% | -0.29% | -0.46% | |
| NZD | 0.03% | 0.22% | 0.21% | -0.32% | 0.38% | 0.29% | -0.17% | |
| CHF | 0.23% | 0.38% | 0.36% | -0.15% | 0.56% | 0.46% | 0.17% |
The heat map shows percentage changes of major currencies against each other. The base currency is picked from the left column, while the quote currency is picked from the top row. For example, if you pick the British Pound from the left column and move along the horizontal line to the US Dollar, the percentage change displayed in the box will represent GBP (base)/USD (quote).

