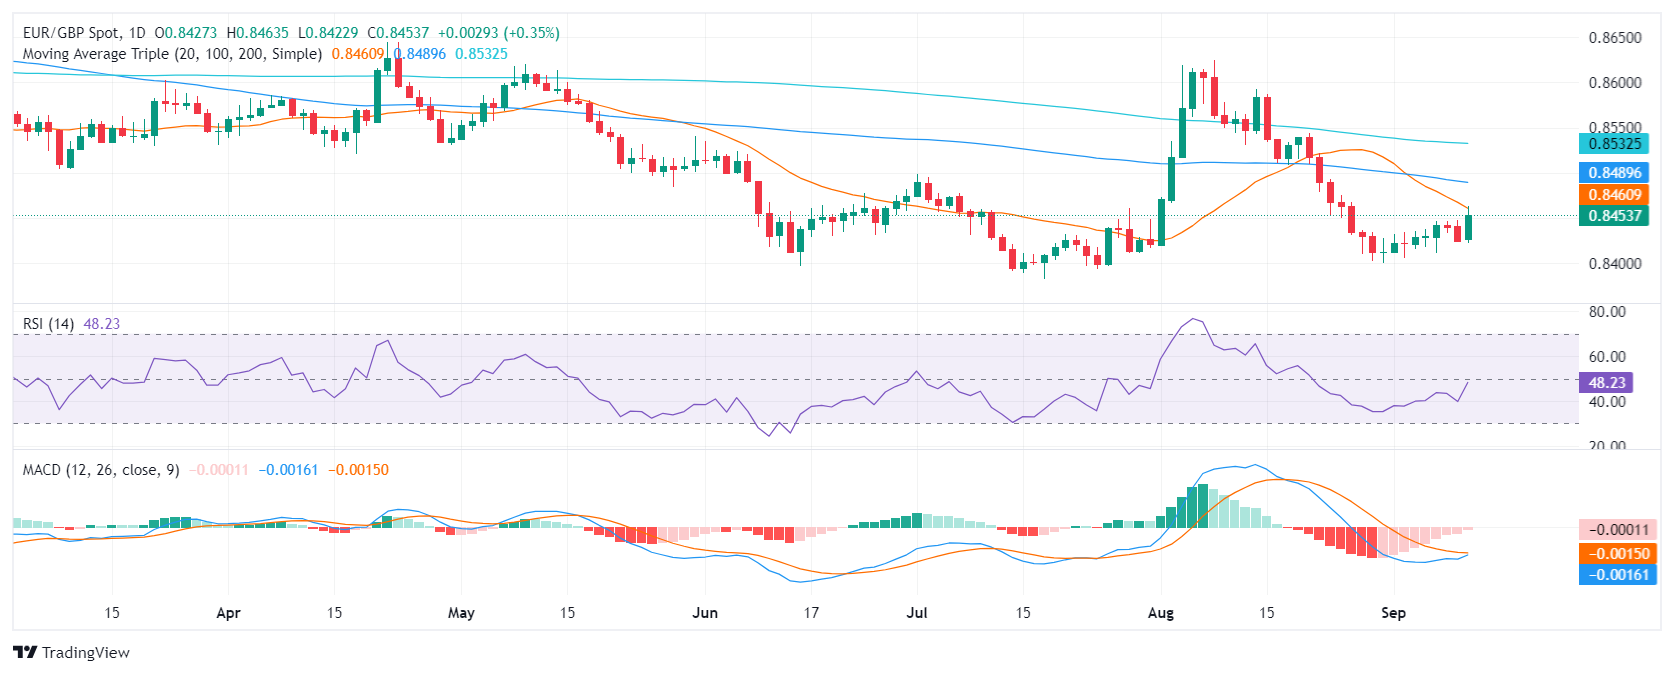
EUR/GBP Price Analysis: Bulls make a stride and challenge the 20-day SMA
- Technical indicators suggest a shift in momentum toward positive territory
- RSI rises near 50, indicating a recovery in buying pressure.
- MACD continues printing decreasing red bars.
In Wednesday's session, when the EUR/GBP broke out and saw 0.40% gains to rise near 0.8450. While bulls made a huge step, they still have more work to do to confirm a recovery.
The Relative Strength Index (RSI) has moved back towards the 50 midpoint, signaling that buying pressure is recovering. This is supported by the flattening of the Moving Average Convergence Divergence (MACD) histogram, with the red bars decreasing and the histogram moving closer to the zero line. This suggests a potential shift in momentum toward positive territory.
However, the overall outlook remains cautious as the choppy and price action in recent candles suggests consolidation for the pair. While the pair has been holding above the 0.8400 support level, the next resistance level to watch is 0.8460 at the 20-day Simple Moving Average (SMA) and a break above could confirm a recovery.
EUR/GBP daily chart

