EUR/CHF Price Prediction: Bullish engulfing candlestick could indicate more upside
- EUR/CHF bottomed and formed a Bullish Engulfing candlestick pattern on September 11.
- Since then it has recovered then pulled back – it could soon resume upside again.
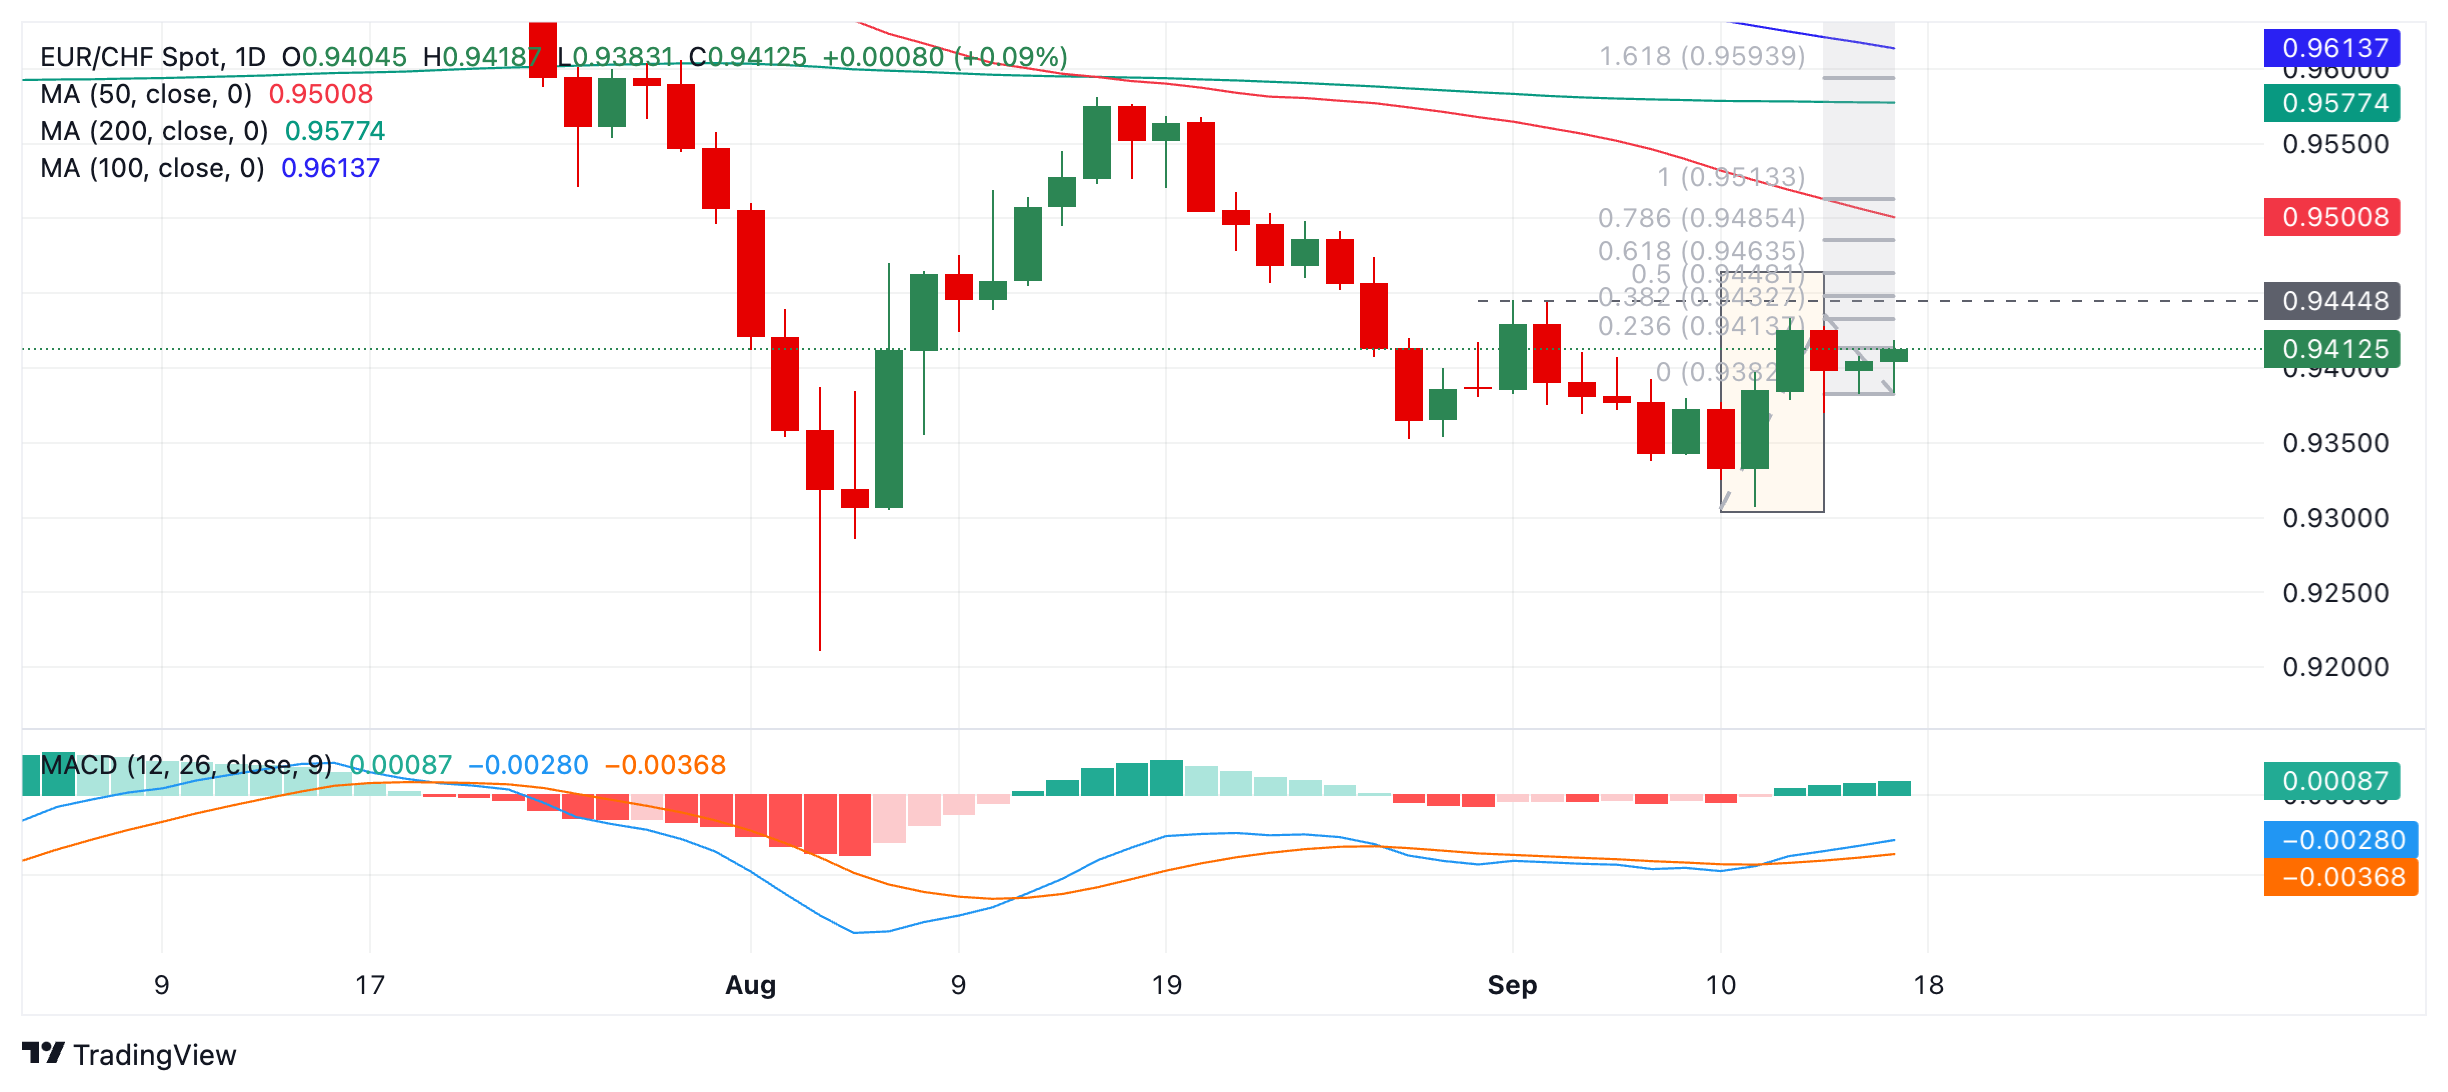
EUR/CHF reached a temporary bottom on September 11 and recovered. It is currently trading above 0.9400. There are signs that suggest it could continue higher despite the overall bearish medium-term trend.
EUR/CHF Daily Chart
EUR/CHF formed a Bullish Engulfing Japanese candlestick pattern when it touched bottom on September 11. This occurs when price bottoms out, recovers and during the recovery day encloses – or "engulfs" – the whole of the preceding day's body in new day's body. The initial engulfing candle was followed by a confirmatory green follow-up day (shaded rectangle) adding confidence. This pattern is a short-term bullish signal.
The pair has pulled back slightly since peaking on September 12, however, the correction has been shallow so far and it is possible the pair will resume moving higher.
A break above the 0.9434 high (September 12) would confirm a continuation higher, with the next target at 0.9464, followed by 0.9513 in the case of a particularly bullish move.
A break below 0.9369 would invalidate the bullish hypothesis and suggest a more neutral or bearish outlook.

