EUR/GBP Price Analysis: Bears show no mercy and push the cross to lows since 2022
- EUR/GBP extended its downtrend on Monday, declining by 0.50% to 0.8335.
- The breach below 0.8350 marked a low since April 2022.
- The RSI has entered the oversold territory, while the MACD signals increasing bearish momentum.
The EUR/GBP pair continued its downward streak on Monday, declining by 0.50% to 0.8335, its lowest level since April 2022. The selling pressure remains relentless, and the technical indicators signal a negative trend, supporting the bearish outlook.
On the daily chart, the Relative Strength Index (RSI) has entered the oversold territory, with a value of 28. This sharp decline indicates that selling pressure is rising. The Moving Average Convergence Divergence (MACD) histogram remains red and rising, also suggesting increasing bearish momentum.
EUR/GBP daily chart
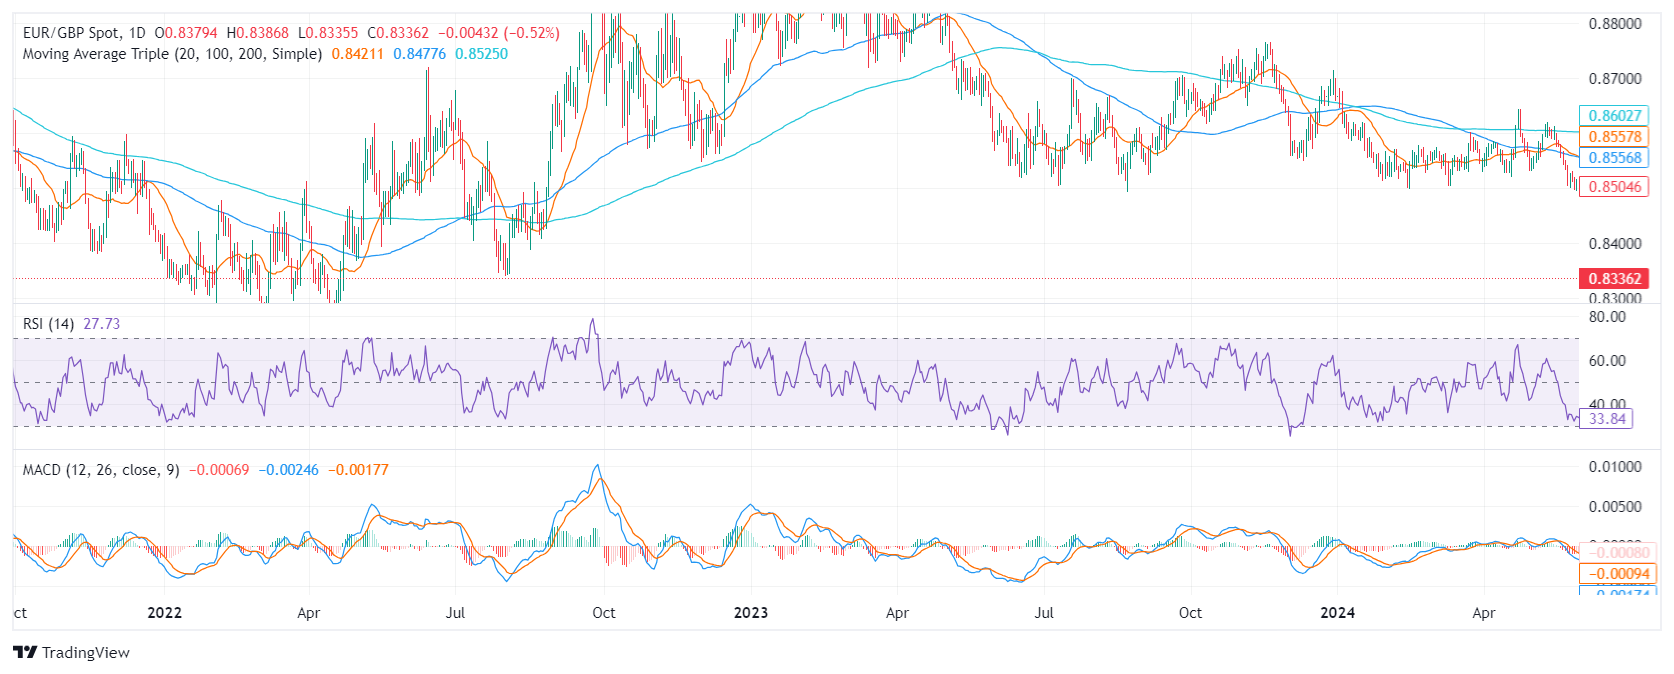
Based on the current technical picture, the EUR/GBP pair is likely to continue its downward trajectory. That being said, indicators entering oversold conditions may suggest that an upward correction may be incoming in the next session as sellers may take a breather to consolidate gains.
Support levels: 0.8330, 0.8310, 0.8300
Resistance levels: 0.8350, 0.8400, 0.8430