NZD/USD Price Analysis: Uptrend halts, pair steps back from multi-month highs
- The NZD/USD pair declined by more than 1% on Wednesday, from highs since January.
- The RSI and MACD indicators are both pointing to decreasing buying momentum.
- Despite the pullback, the pair remains in a strongly bullish outlook.
On Wednesday, the NZD/USD pair encountered selling pressure, declining by 1.20% and settling at 0.6260. This reversal halted a five-day winning streak and marked a retreat from multi-month highs reached on Tuesday.
The technical indicators suggest that the buying pressure behind NZD/USD is decreasing. The Relative Strength Index (RSI) has risen near the overbought threshold, but it is currently declining sharply, indicating that buying pressure is easing. Similarly, the Moving Average Convergence Divergence (MACD) histogram remains green, but it is also decreasing, aligning with the RSI's bearish signals.
NZD/USD daily chart
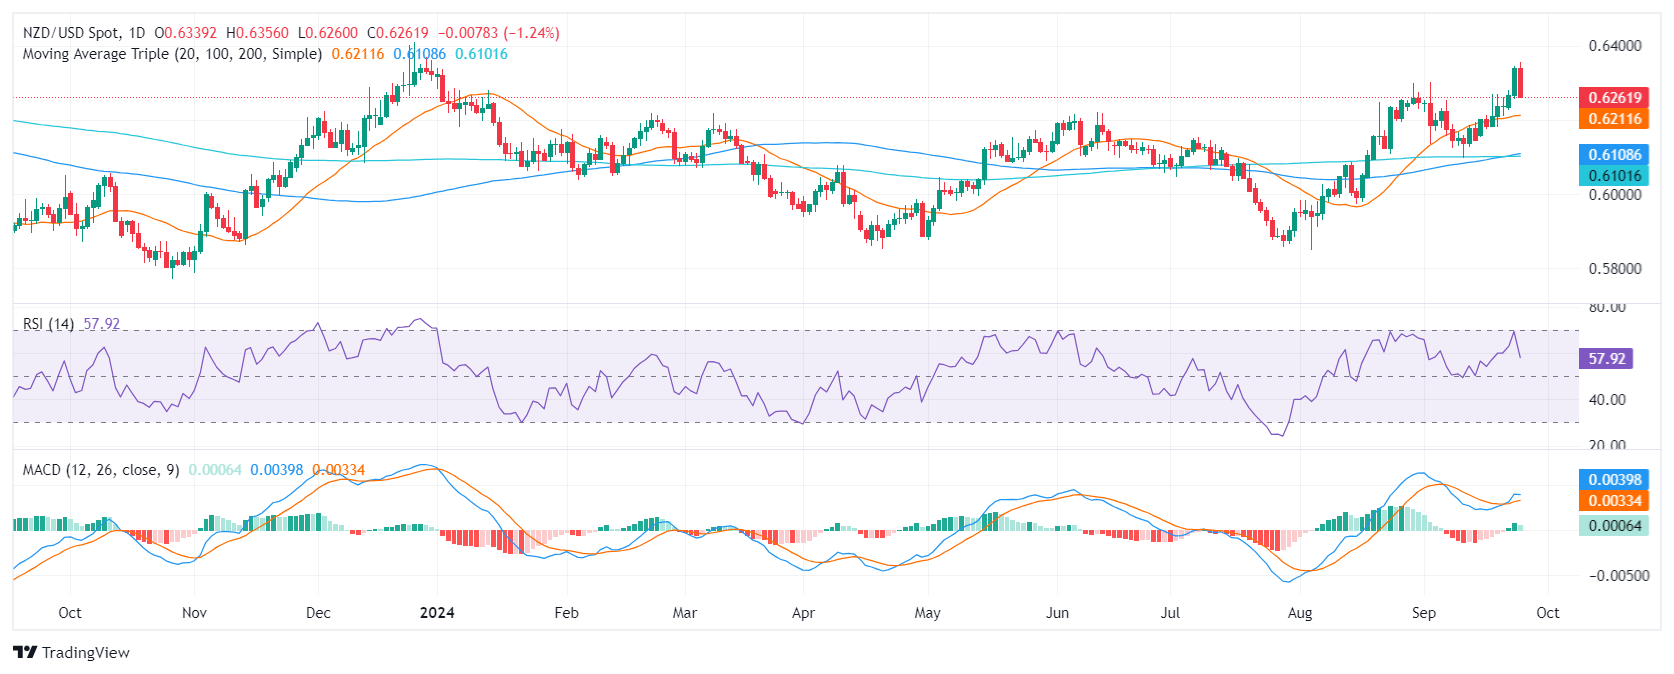
Despite the pullback, the NZD/USD pair maintains a strongly bullish outlook. The pair is trading above its key moving averages, and still near its yearly highs. On the upside, resistance levels to watch include 0.6300, 0.6350, and 0.6400. If the pair fails to jump back above 0.6300, it could experience a deeper correction, probably toward 0.6200.