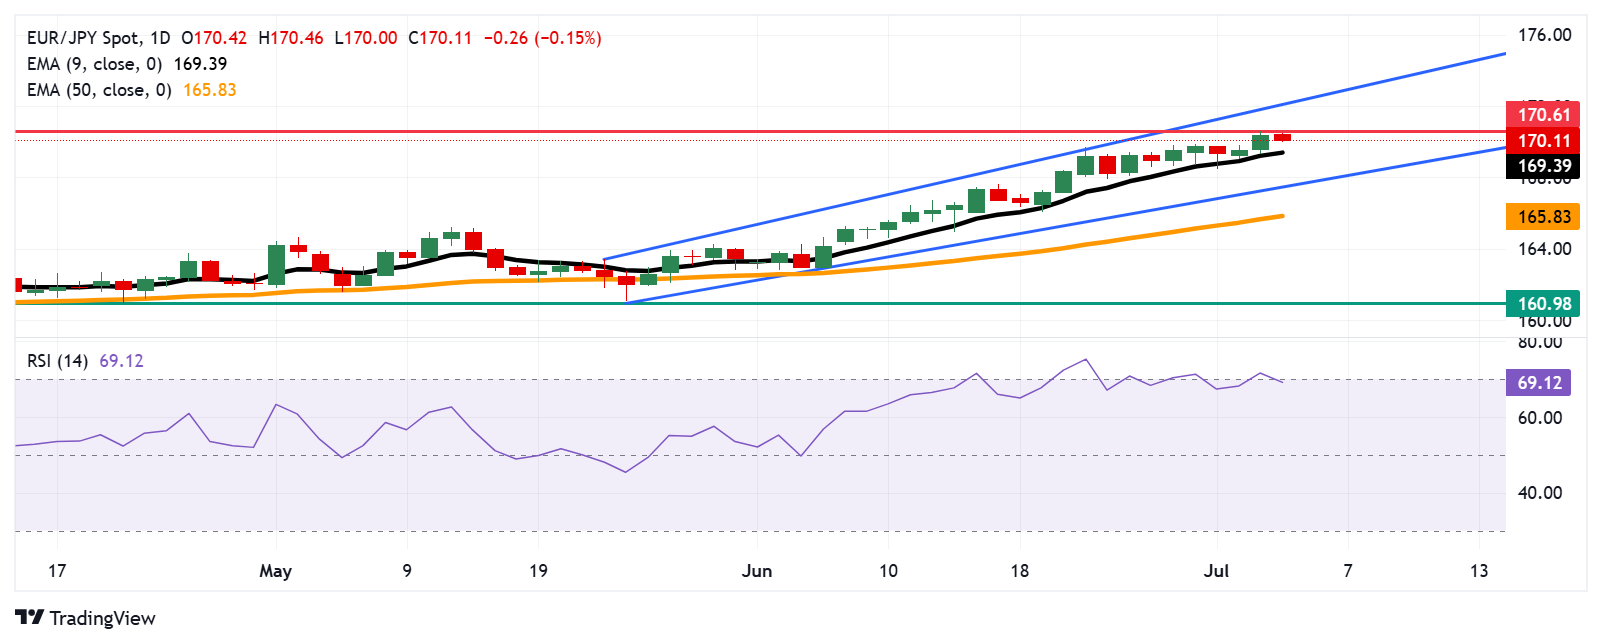
EUR/JPY Price Forecast: Trades around 170.00 after pulling back from fresh yearly highs
- EUR/JPY may retest the new yearly high at 170.61, marked on Thursday.
- The 14-day RSI remains near 70, signaling overbought conditions and the possibility of a downward correction.
- The nine-day EMA of 169.39 would act as the primary support.
EUR/JPY retreats after reaching one-year highs on Thursday, trading around 170.10 during the Asian hours on Friday. The bullish bias is strengthening as the technical analysis of the daily chart shows that the currency cross moves upwards within the ascending channel pattern.
The market outlook remains bullish as the 14-day Relative Strength Index (RSI) is continuing to hover around the 70 mark. However, traders may exercise caution, as the pair appears overbought and a potential downward correction could be on the horizon. Additionally, the short-term price momentum is stronger as the EUR/JPY cross remains above the nine-day Exponential Moving Average (EMA).
On the upside, the EUR/JPY cross may test the yearly high at 170.61, which was recorded on July 3. A successful breach above this level would reinforce the bullish bias and support the currency cross to test the upper boundary of the ascending channel around 172.10.
The initial support appears at the nine-day EMA of 169.39. Further declines would weaken the short-term price momentum and put downward pressure on the EUR/JPY cross to fall toward the ascending channel’s lower boundary around 167.50, followed by the 50-day EMA at 165.83. A break below the 50-day EMA would weaken the medium-term price momentum and prompt the pair to navigate the area around the “throwback resistance” at 161.00
EUR/JPY: Daily Chart

Euro PRICE Today
The table below shows the percentage change of Euro (EUR) against listed major currencies today. Euro was the weakest against the Japanese Yen.
| USD | EUR | GBP | JPY | CAD | AUD | NZD | CHF | |
|---|---|---|---|---|---|---|---|---|
| USD | -0.19% | -0.18% | -0.39% | -0.08% | 0.04% | -0.07% | -0.31% | |
| EUR | 0.19% | 0.04% | -0.17% | 0.14% | 0.11% | 0.10% | -0.08% | |
| GBP | 0.18% | -0.04% | -0.24% | 0.11% | 0.09% | 0.07% | -0.12% | |
| JPY | 0.39% | 0.17% | 0.24% | 0.32% | 0.30% | 0.24% | -0.01% | |
| CAD | 0.08% | -0.14% | -0.11% | -0.32% | -0.02% | -0.02% | -0.21% | |
| AUD | -0.04% | -0.11% | -0.09% | -0.30% | 0.02% | -0.06% | -0.21% | |
| NZD | 0.07% | -0.10% | -0.07% | -0.24% | 0.02% | 0.06% | -0.18% | |
| CHF | 0.31% | 0.08% | 0.12% | 0.01% | 0.21% | 0.21% | 0.18% |
The heat map shows percentage changes of major currencies against each other. The base currency is picked from the left column, while the quote currency is picked from the top row. For example, if you pick the Euro from the left column and move along the horizontal line to the US Dollar, the percentage change displayed in the box will represent EUR (base)/USD (quote).
