EUR/JPY Price Forecast: Crosses above 170.00, refreshes yearly highs
- EUR/JPY climbs to 170.42, its highest level since July 2024.
- Bullish trend intact above Ichimoku Cloud, RSI nears overbought zone.
- A break above 171.09 opens path to 172.00 psychological resistance.
- Drop below 170.00 could trigger pullback toward 169.25 or July swing low at 168.45.
The EUR/JPY crosses the 170.00 threshold in the year, for the first time since July of last year, though posts minimal losses of 0.10% after hitting a yearly peak of 170.42. At the time of writing, the cross trades at 170.18 due to a risk-off environment, as US equity futures tumble amid thin volume trading, with the US markets closed in observance of US Independence Day.
EUR/JPY Price Forecast: Technical outlook
The upside path is intact, after the Japanese Yen rallied during the first two months of the second half of 2024, sending the EUR/JPY from around 175.42 to 154.39. Since then, the pair has enjoyed a recovery, paving the way for higher prices to be tested.
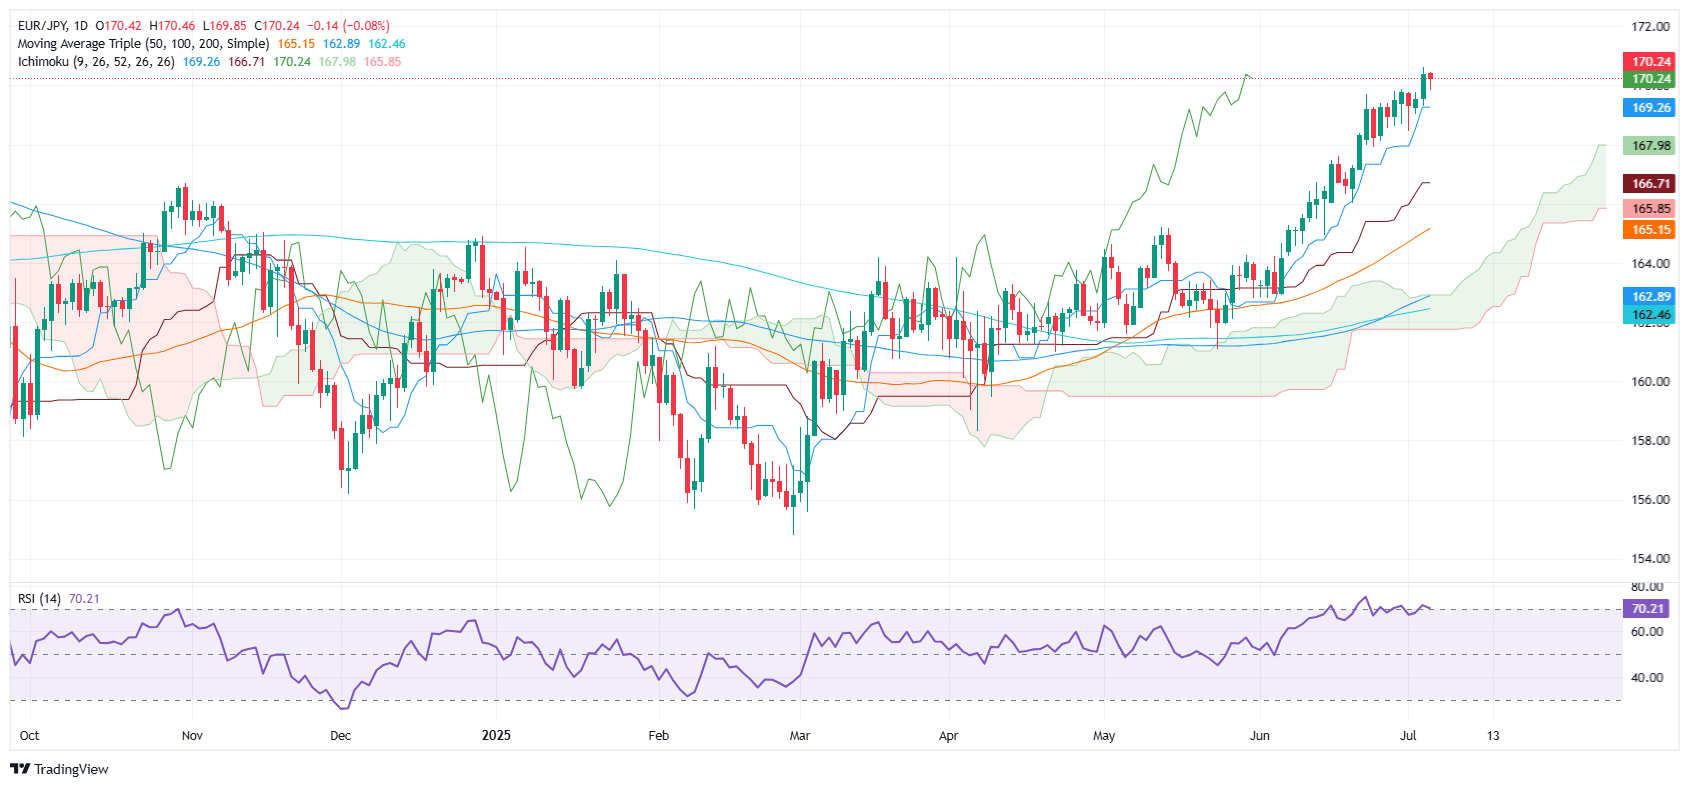
Momentum, although slightly overbought as depicted by the Relative Strength Index (RSI), is bullish. Worth noting that the EUR/JPY has been climbing steadily, after crossing above the Ichimoku Cloud (Kumo) on March 12.
The first key resistance would be the July 23, 2024, daily high at 171.09. A breach of the latter will expose July 19, 2024, high at 171.87, before testing the 172.00 mark. Conversely, if EUR/JPY drops below 170.00, a move towards the Tenkan-sen at 169.25 is likely. Further downside is seen at 168.45, the July 1 swing low.
EUR/JPY Price Chart – Daily
Euro PRICE This week
The table below shows the percentage change of Euro (EUR) against listed major currencies this week. Euro was the strongest against the British Pound.
| USD | EUR | GBP | JPY | CAD | AUD | NZD | CHF | |
|---|---|---|---|---|---|---|---|---|
| USD | -0.40% | 0.49% | 0.13% | -0.60% | -0.17% | 0.02% | -0.64% | |
| EUR | 0.40% | 0.86% | 0.53% | -0.21% | 0.20% | 0.43% | -0.25% | |
| GBP | -0.49% | -0.86% | -0.49% | -1.05% | -0.66% | -0.43% | -1.10% | |
| JPY | -0.13% | -0.53% | 0.49% | -0.74% | -0.25% | -0.07% | -0.72% | |
| CAD | 0.60% | 0.21% | 1.05% | 0.74% | 0.38% | 0.63% | -0.04% | |
| AUD | 0.17% | -0.20% | 0.66% | 0.25% | -0.38% | 0.21% | -0.44% | |
| NZD | -0.02% | -0.43% | 0.43% | 0.07% | -0.63% | -0.21% | -0.66% | |
| CHF | 0.64% | 0.25% | 1.10% | 0.72% | 0.04% | 0.44% | 0.66% |
The heat map shows percentage changes of major currencies against each other. The base currency is picked from the left column, while the quote currency is picked from the top row. For example, if you pick the Euro from the left column and move along the horizontal line to the US Dollar, the percentage change displayed in the box will represent EUR (base)/USD (quote).