USD/JPY Price Forecast: Overbought RSI flashes caution, but upside bias intact
- USD/JPY climbs to mid-January highs as US Dollar strength and Yen weakness persist.
- Price action firmly above the 21, 50 and 100-day SMAs keeps the broader uptrend intact.
- Momentum remains elevated, with RSI in overbought territory but showing no exhaustion signals yet.
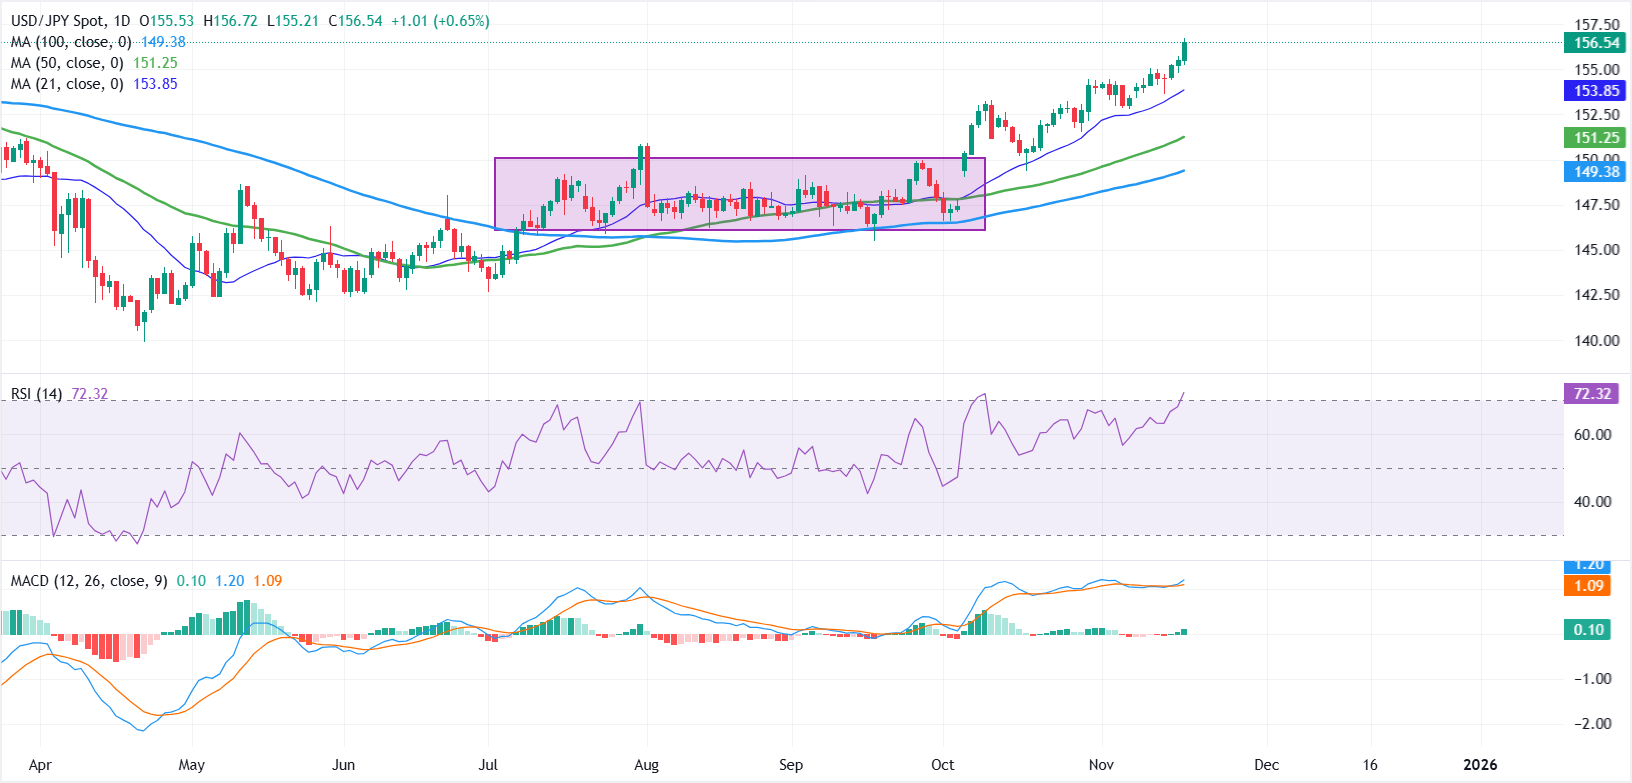
USD/JPY extends its upward trajectory on Wednesday, with the pair surging to levels last seen in mid-January. At the time of writing, the pair trades around 156.54, up nearly 0.65%, marking a third straight day of gains as a strong US Dollar (USD) and a broadly weaker Japanese Yen (JPY) continue to provide a double boost.

The technical backdrop remains firmly bullish. Since breaking out of the multi-month choppy consolidation range in early October, the pair has maintained a steady sequence of higher highs and higher lows, reflecting strong directional momentum.
A bullish opening gap sparked the breakout above the 150.00 psychological level, initially driven by reports that Sanae Takaichi was set to become Japan’s next Prime Minister. Markets interpreted this as a signal of potential fiscal expansion, weakening the Yen. Once she officially assumed office, confirmation of a large-scale fiscal stimulus plan strengthened those expectations further, keeping the Yen under persistent downward pressure.
Price action remains comfortably above all major Simple Moving Averages (21-SMA, 50-SMA, 100-SMA) on the daily chart, underlining buyer dominance and reinforcing the bullish trend structure.
On the topside, the January 23 swing high at 156.75 serves as immediate resistance. A clear break above this level could pave the way for a retest of the year-to-date high at 158.88, marked on January 10.
On the downside, 155.00 is the first line of support, followed by the 21-day SMA at 153.86. While Japanese authorities have issued intermittent verbal warnings about excessive Yen weakness, concrete intervention remains absent, making a deeper corrective pullback possible but not the base case in the near term.
Momentum indicators warrant some caution. The Relative Strength Index (RSI) sits near 72, holding in overbought territory, which could slow bullish follow-through or prompt brief consolidation. However, no clear bearish divergence has formed yet.
US Dollar Price Today
The table below shows the percentage change of US Dollar (USD) against listed major currencies today. US Dollar was the strongest against the New Zealand Dollar.
| USD | EUR | GBP | JPY | CAD | AUD | NZD | CHF | |
|---|---|---|---|---|---|---|---|---|
| USD | 0.29% | 0.54% | 0.66% | 0.41% | 0.69% | 1.01% | 0.60% | |
| EUR | -0.29% | 0.24% | 0.38% | 0.14% | 0.40% | 0.75% | 0.31% | |
| GBP | -0.54% | -0.24% | 0.12% | -0.12% | 0.16% | 0.48% | 0.07% | |
| JPY | -0.66% | -0.38% | -0.12% | -0.24% | 0.04% | 0.35% | -0.05% | |
| CAD | -0.41% | -0.14% | 0.12% | 0.24% | 0.28% | 0.59% | 0.18% | |
| AUD | -0.69% | -0.40% | -0.16% | -0.04% | -0.28% | 0.33% | -0.09% | |
| NZD | -1.01% | -0.75% | -0.48% | -0.35% | -0.59% | -0.33% | -0.41% | |
| CHF | -0.60% | -0.31% | -0.07% | 0.05% | -0.18% | 0.09% | 0.41% |
The heat map shows percentage changes of major currencies against each other. The base currency is picked from the left column, while the quote currency is picked from the top row. For example, if you pick the US Dollar from the left column and move along the horizontal line to the Japanese Yen, the percentage change displayed in the box will represent USD (base)/JPY (quote).
