Dow Jones Industrial Average churns on Thursday as markets turn cautious
- The Dow Jones fell over 1,100 points peak-to-trough on Thursday after early gains.
- Markets soured following Nvidia’s after-hours earnings as revenues remain murky.
- A surge in September’s NFP solidified market expectations for a Fed rate hold in December.
The Dow Jones started Thursday off on a high note. The major equity index soared 725 points in the early hours before promptly reversing course at 1545 GMT (1045 EST) and sinking over 1,100 points top-to-bottom, hitting a five-week low of 45,732 in the process. Markets are facing fresh headwinds on multiple fronts, and a poorly-timed announcement that the Nonfarm Payrolls (NFP) employment “situation” data releases would be delayed until December 16th was the cherry on top.
The Dow Jones Industrial Average is down 2.2% on the week, and on pace for its worst weekly performance since the beginning of October. Equities are facing fresh challenges across the board, with the tech-heavy NASDAQ 100 down around 0.6% for the day after testing its lowest bids in nearly nine weeks. The Dow found an eventual foothold to reclaim the 46,000 handle in midday trading, but still remains on the defensive, down around -0.2% on Thursday.
AI under a microscope as high chip demand still doesn't mean high revenues
The AI trade remains under threat, with investor trepidation on the rise in the face of hard mathematics disagreeing with pie-eyed expectations of infinite earnings potential. Nvidia (NVDA) posted strong paper figures during its after-market earnings call after the closing bell on Wednesday, claiming another quarter of strong double-digit demand growth for its AI-focused chipsets. However, skeptical analysts noted that several key categories in Nvidia’s earnings should raise concern among tech wonks.
According to Nvidia’s earnings call, the chipmaker stockpiled nearly $20 billion in unsold product, a 32% increase in a single quarter. For a company claiming “strong demand growth”, it represents a worrying increase in stockpiles. Nvidia also posted $19.3 billion in quarterly revenue, but only $14.5 billion of that converted to cash, leaving an almost $5 billion shortfall between cash and earnings, a significantly slower pace of cash generation compared to Nvidia’s peers.
NFP data pipeline has resumed, but delays leave rate cut hopes on the floor
September’s backdated Nonfarm Payrolls (NFP) was released on Thursday following the recent resumption of federal government operations, showing a surprising upswing of 119K in the number of net new jobs created during the month. The strong NFP showing has limited the chances of a Federal Reserve (Fed) interest rate cut on December 10. October’s and November’s NFP releases have been delayed until December 16, pushing out market expectations for a third interest rate trim to the Fed’s January rate call.
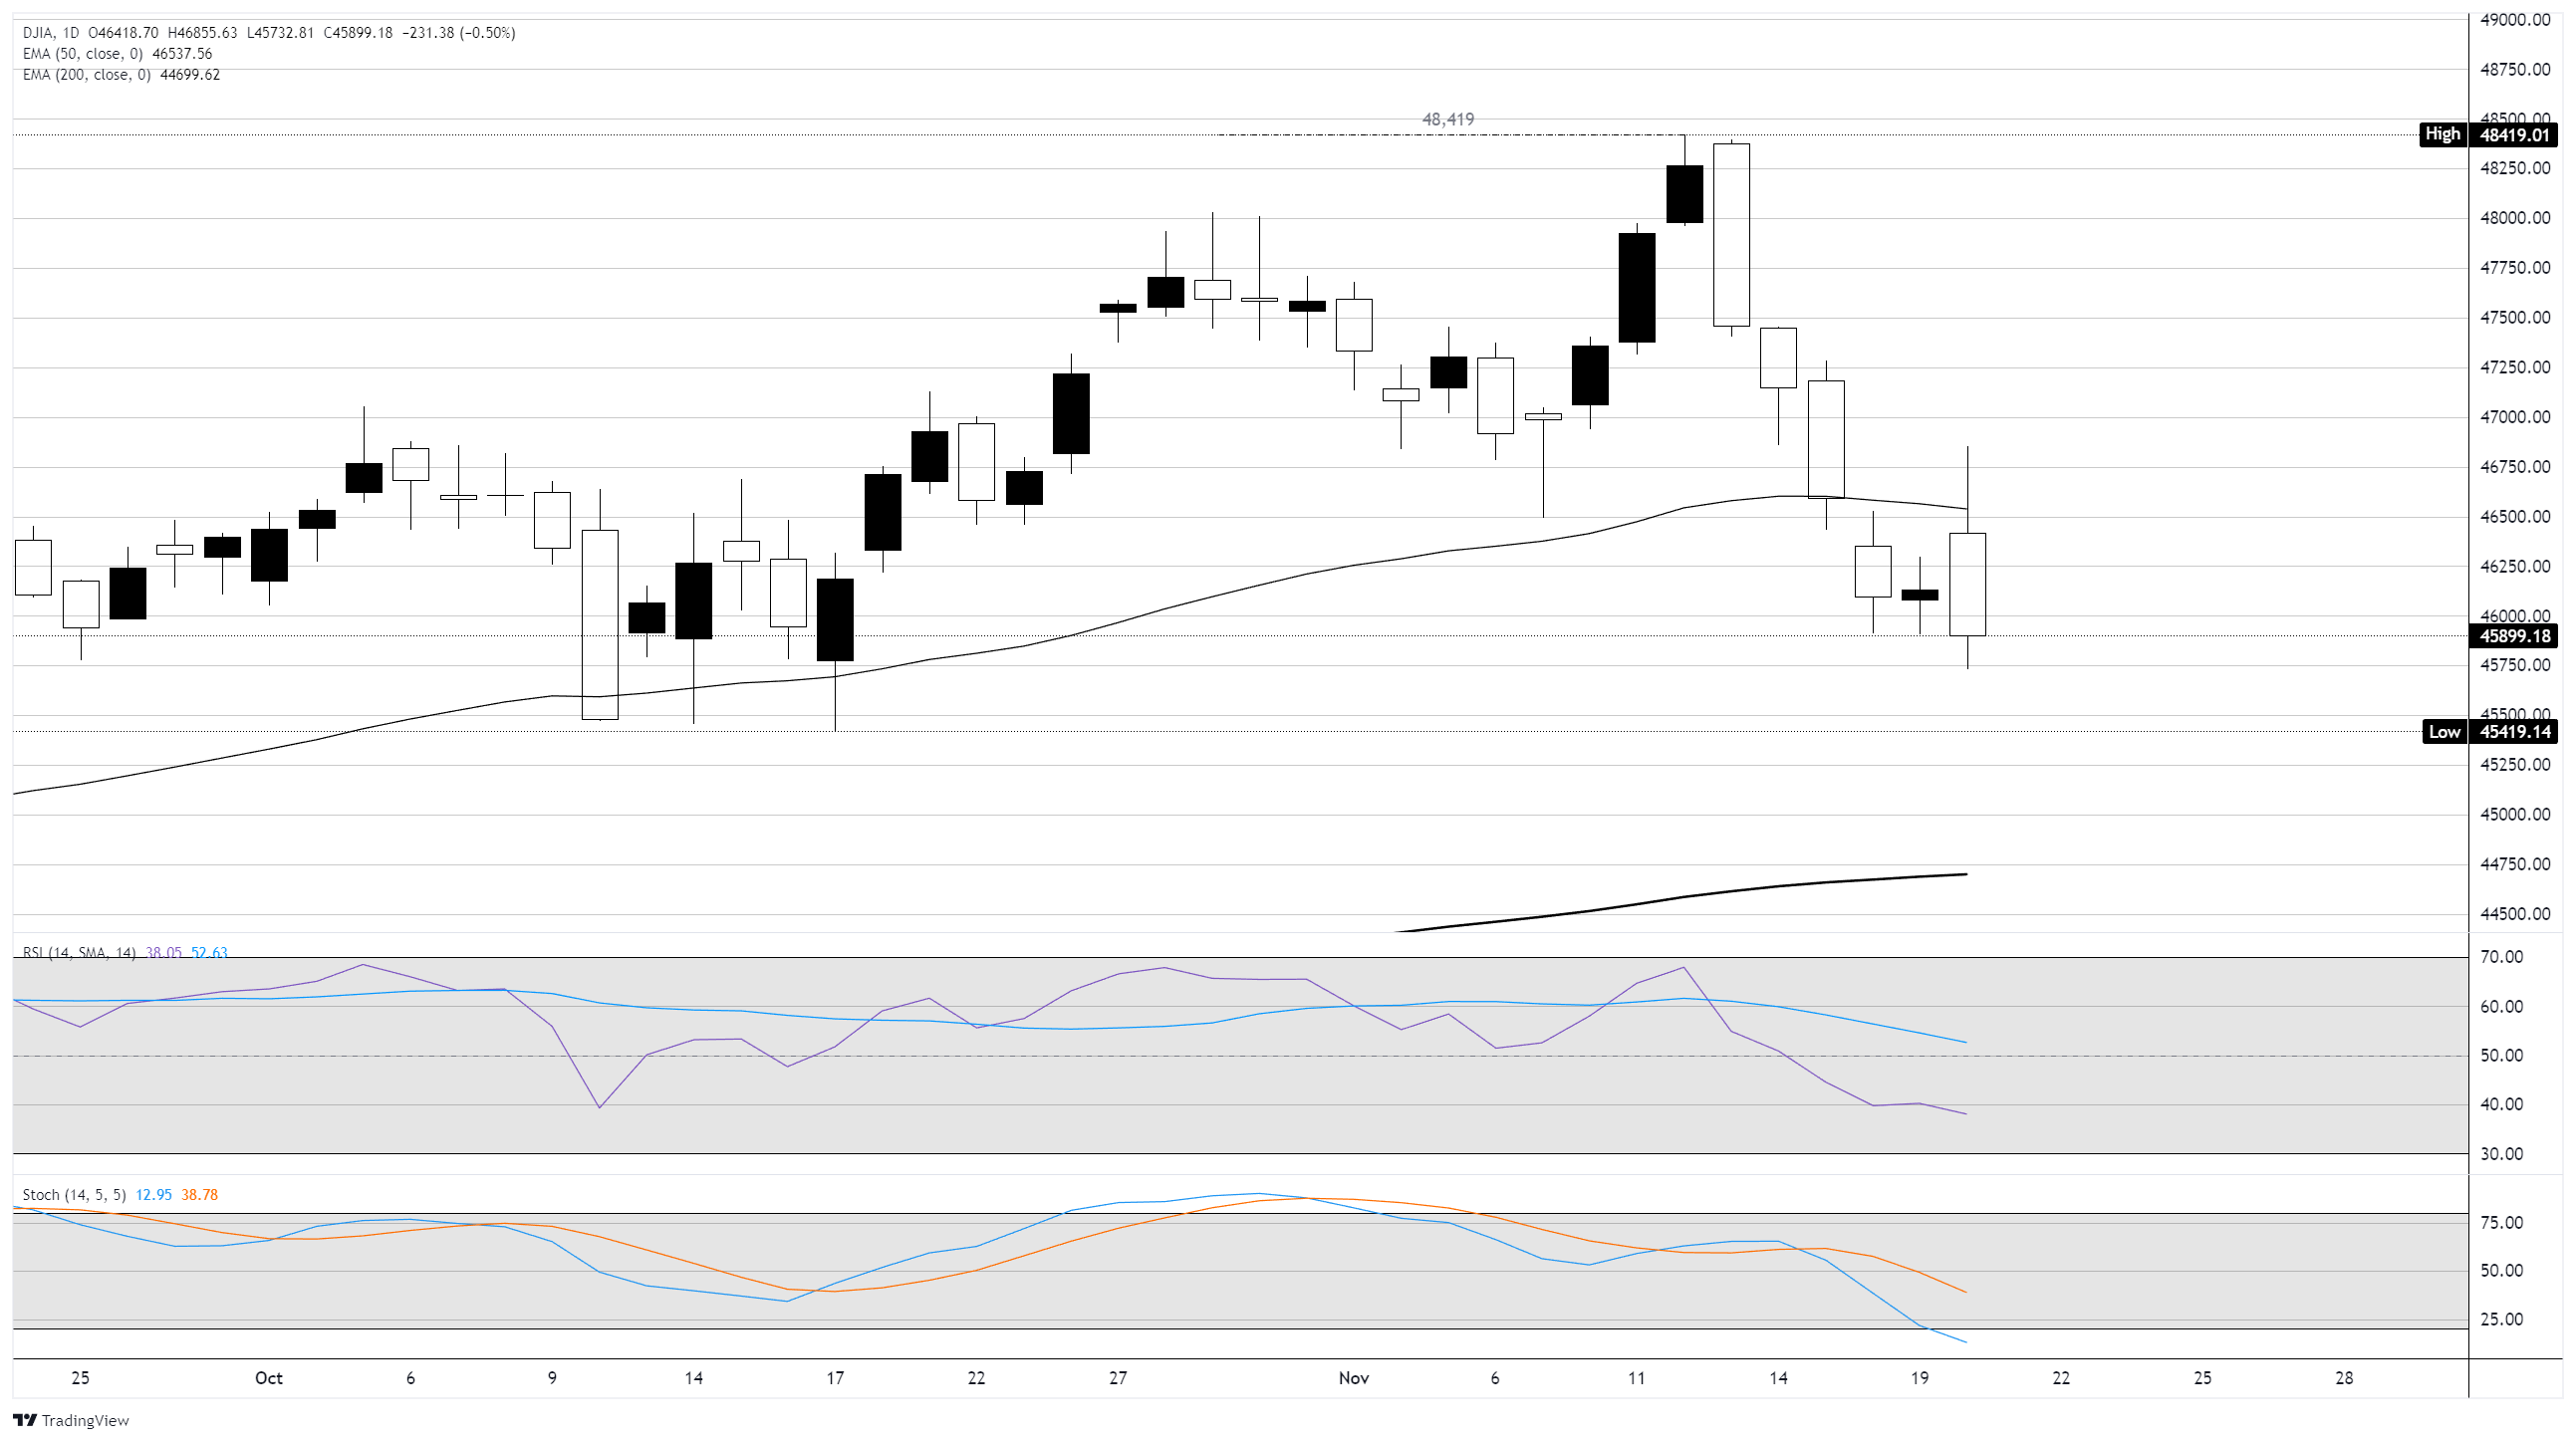
Dow Jones daily chart
Dow Jones FAQs
The Dow Jones Industrial Average, one of the oldest stock market indices in the world, is compiled of the 30 most traded stocks in the US. The index is price-weighted rather than weighted by capitalization. It is calculated by summing the prices of the constituent stocks and dividing them by a factor, currently 0.152. The index was founded by Charles Dow, who also founded the Wall Street Journal. In later years it has been criticized for not being broadly representative enough because it only tracks 30 conglomerates, unlike broader indices such as the S&P 500.
Many different factors drive the Dow Jones Industrial Average (DJIA). The aggregate performance of the component companies revealed in quarterly company earnings reports is the main one. US and global macroeconomic data also contributes as it impacts on investor sentiment. The level of interest rates, set by the Federal Reserve (Fed), also influences the DJIA as it affects the cost of credit, on which many corporations are heavily reliant. Therefore, inflation can be a major driver as well as other metrics which impact the Fed decisions.
Dow Theory is a method for identifying the primary trend of the stock market developed by Charles Dow. A key step is to compare the direction of the Dow Jones Industrial Average (DJIA) and the Dow Jones Transportation Average (DJTA) and only follow trends where both are moving in the same direction. Volume is a confirmatory criteria. The theory uses elements of peak and trough analysis. Dow’s theory posits three trend phases: accumulation, when smart money starts buying or selling; public participation, when the wider public joins in; and distribution, when the smart money exits.
There are a number of ways to trade the DJIA. One is to use ETFs which allow investors to trade the DJIA as a single security, rather than having to buy shares in all 30 constituent companies. A leading example is the SPDR Dow Jones Industrial Average ETF (DIA). DJIA futures contracts enable traders to speculate on the future value of the index and Options provide the right, but not the obligation, to buy or sell the index at a predetermined price in the future. Mutual funds enable investors to buy a share of a diversified portfolio of DJIA stocks thus providing exposure to the overall index.