When is the flash US S&P Global PMI data and how could it affect EUR/USD?
US flash PMI Overview
The preliminary United States (US) S&P Global Purchasing Managers’ Index (PMI) data for January is due for release today at 14:45 GMT.
According to preliminary estimates, the US Composite PMI expanded at a faster pace due to an improvement in both manufacturing and the service sector activity. In December, the Composite PMI came in at 52.7.
Flash US Services PMI is expected to come in at 52.8, higher than 52.5 in December. The Manufacturing PMI is seen rising to 52.1 from the prior reading of 51.8.
Signs of strength in the US private sector activity would be favorable for the US Dollar (USD), while weak numbers would act as a drag.
How could US flash PMI affect EUR/USD?
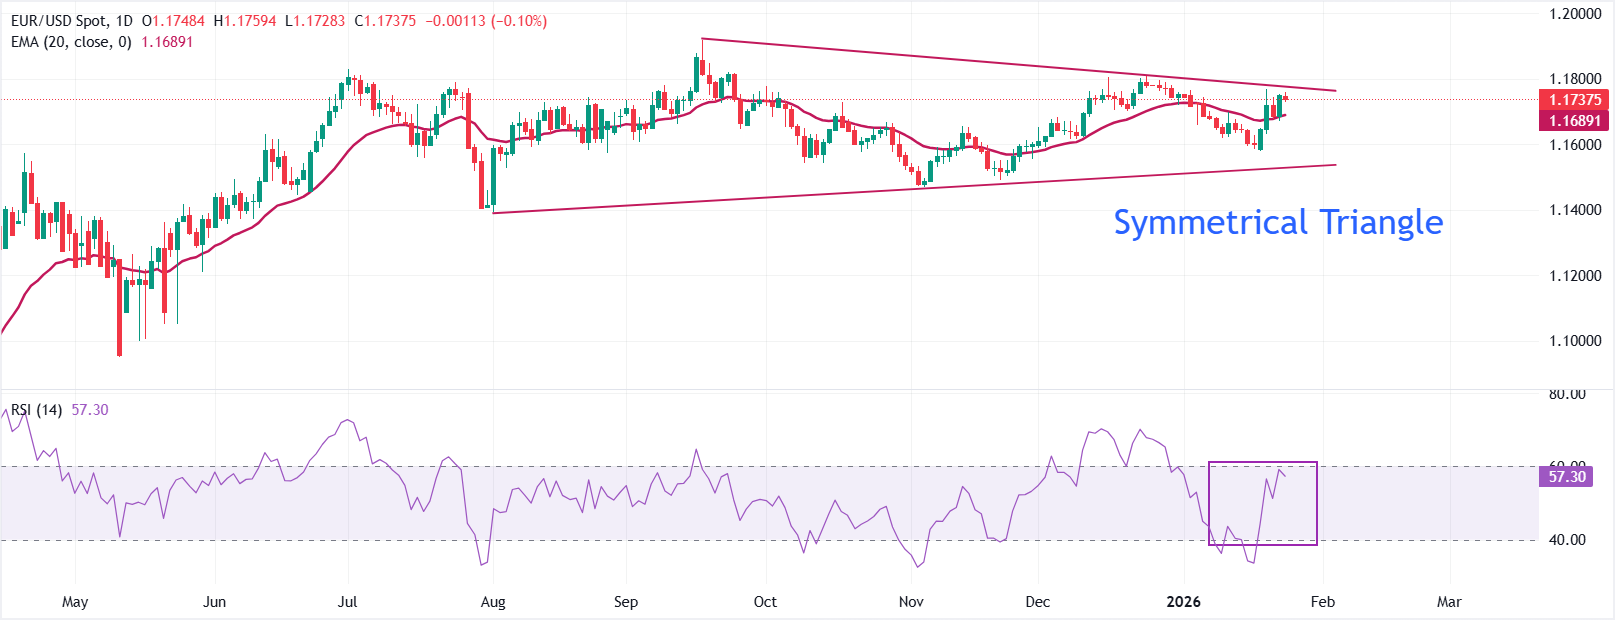
EUR/USD trades subduedly near 1.1738 at the time of writing. The major currency pair trades within a Symmetrical Triangle on the daily chart, indicating broader volatility contraction. The price is close to the upper boundary of the volatility contraction pattern around 1.1770, which is plotted from the multi-year high of 1.1919 posted on September 17.
The 20-day Exponential Moving Average (EMA) at 1.1689 edges higher and holds below the price, supporting the rebound. Its slope has turned up, reinforcing the near-term tone.
The 14-day Relative Strength Index (RSI) at 57 (neutral) has eased from recent highs yet remains above the midline, keeping momentum steady.
Looking up, the pair could advance towards 1.1800 and 1.1900 following a decisive breakout of the January 20 high at 1.1769. On the upside, the 20-day EMA will act as key support for the pair.
(The technical analysis of this story was written with the help of an AI tool.)
Economic Indicator
S&P Global Services PMI
The S&P Global Services Purchasing Managers Index (PMI), released on a monthly basis, is a leading indicator gauging business activity in the US services sector. As the services sector dominates a large part of the economy, the Services PMI is an important indicator gauging the state of overall economic conditions. The data is derived from surveys of senior executives at private-sector companies from the services sector. Survey responses reflect the change, if any, in the current month compared to the previous month and can anticipate changing trends in official data series such as Gross Domestic Product (GDP), industrial production, employment and inflation. A reading above 50 indicates that the services economy is generally expanding, a bullish sign for the US Dollar (USD). Meanwhile, a reading below 50 signals that activity among service providers is generally declining, which is seen as bearish for USD.
Read more.Next release: Fri Jan 23, 2026 14:45 (Prel)
Frequency: Monthly
Consensus: 52.8
Previous: 52.5
Source: S&P Global