Back
12 Jul 2024
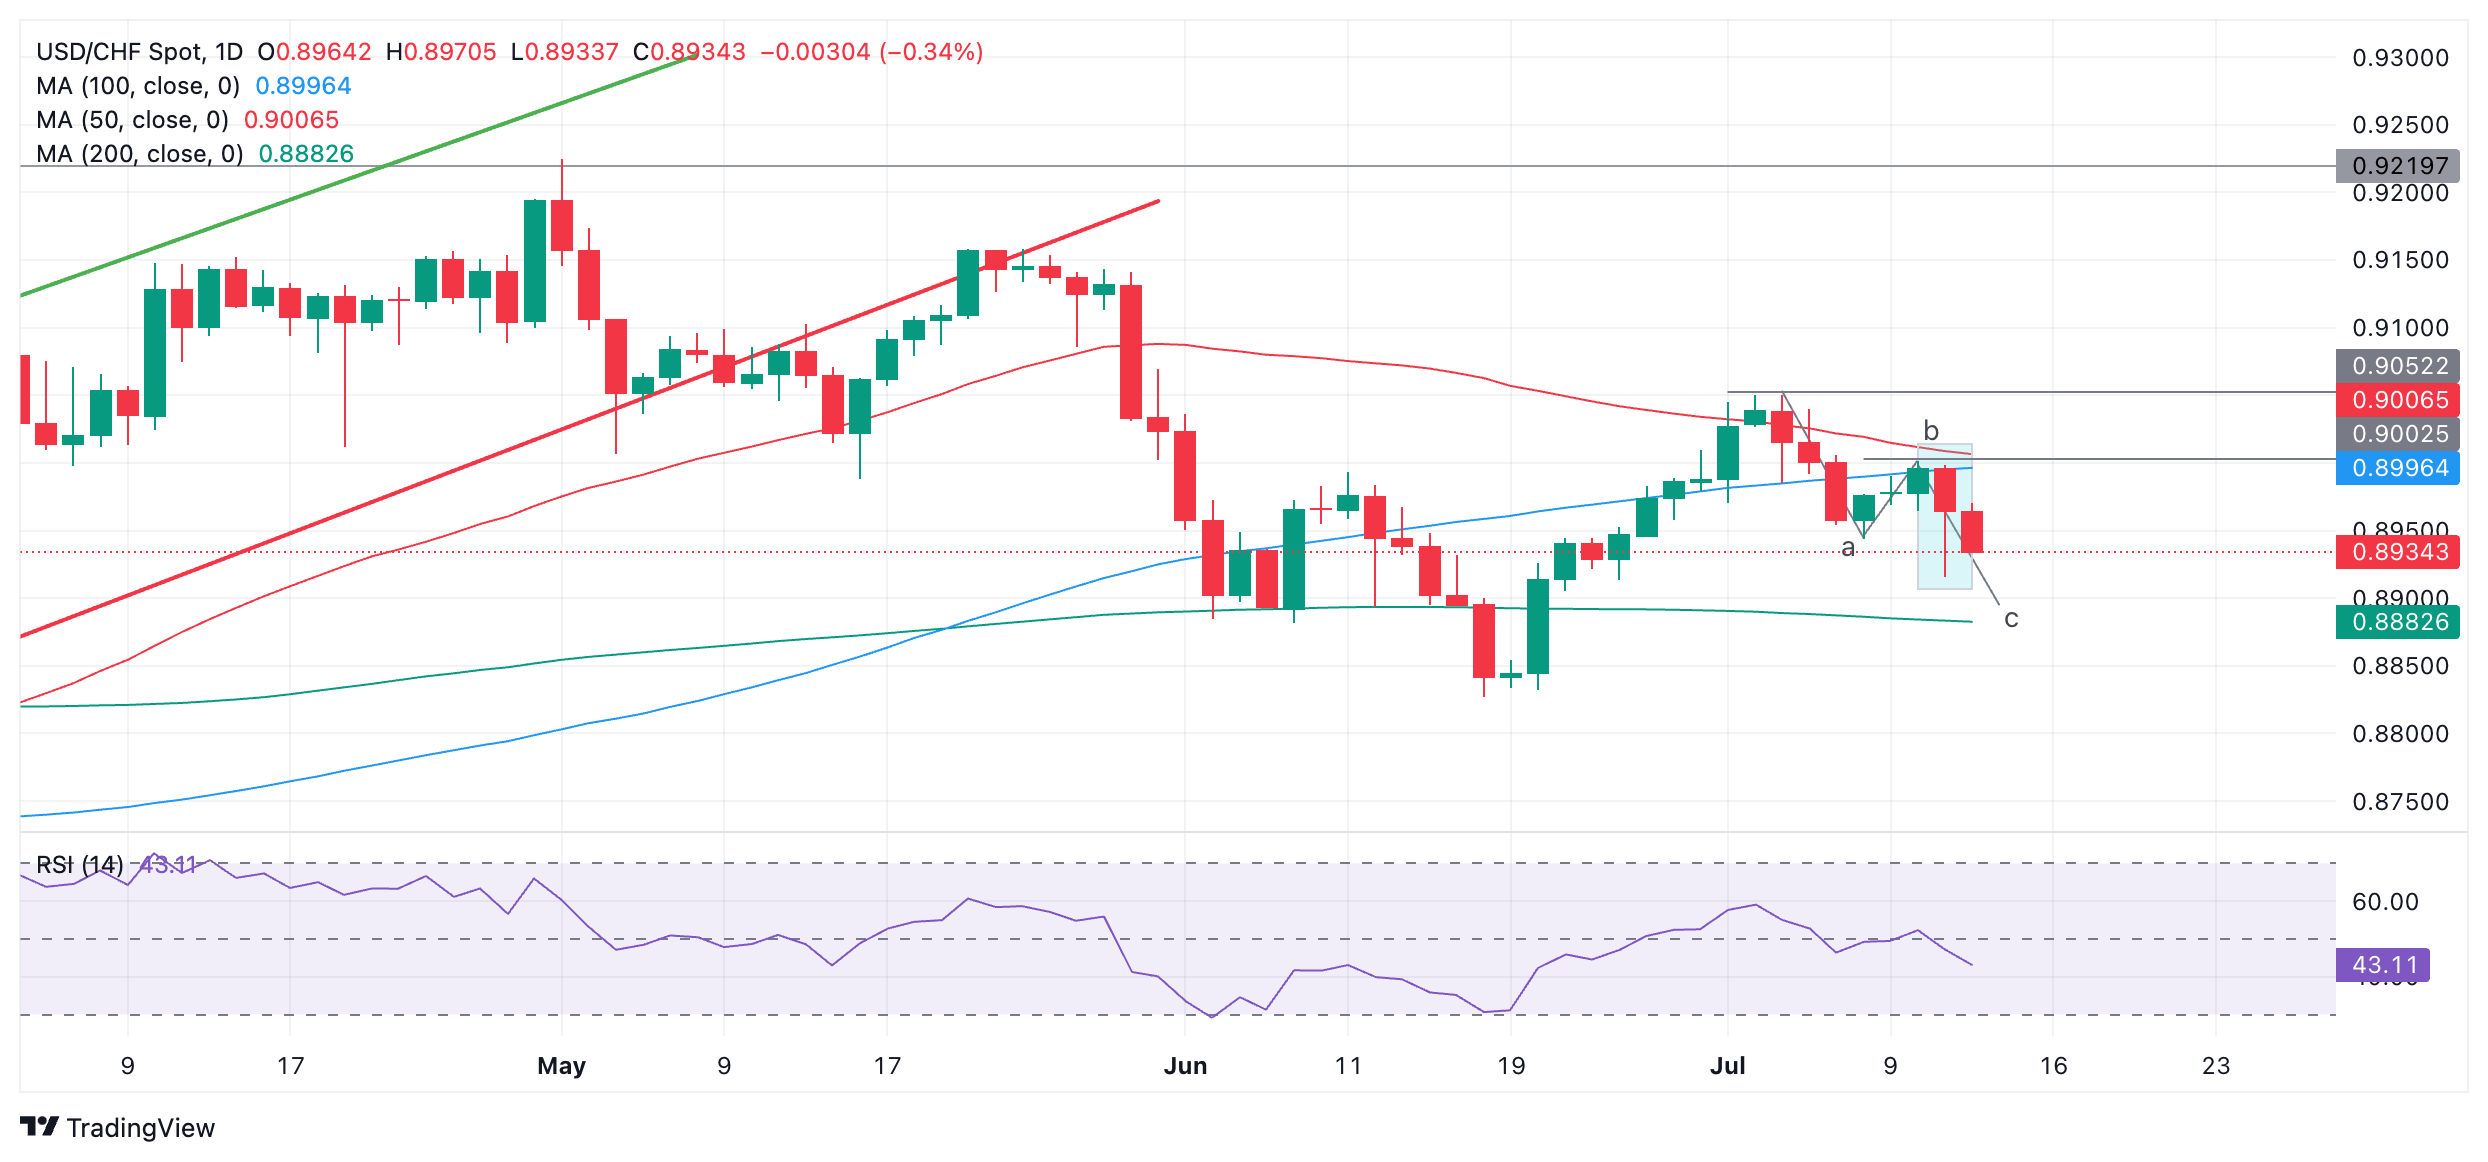
USD/CHF Price Analysis: Correcting back in wave C of an ABC pattern
- USD/CHF is correcting back after the rally in late June and early July.
- It is currently unfolding the wave C of an ABC corrective pattern.
USD/CHF is declining in what looks like the wave C of a three-wave ABC correction. The correction is from the rally that took place between the June 18 lows at 0.8827 up to the July 3 peak at 0.9051.
USD/CHF Daily Chart
The pair has not yet reached the end of wave C and could still fall further, however, it has reached the conservative target for C, which is the Fibonacci 0.618 ratio of the length of wave A.
If USD/CHF falls further it could find support at the 200-day Simple Moving Average (SMA) at 0.8883.
Alternatively, a close above the July 10 high and the 50-day SMA at 0.9007 would probably signal a reversal higher, with the next target at 0.9051, the July 3 high.

