NZD/USD Price Analysis: Sellers gain ground and breach the key 0.6000 level
- NZD/USD stumbles downwards, surrendering the pivotal 0.6000 mark, following its worst week since January.
- The pair settled at 0.5980 on Monday, ensuring a daily loss of approximately 0.50%.
- NZD/USD continues to remain under the key SMA of 20, 100, and 200 days, suggesting a prevailing bearish bias.
In Monday's session, the NZD/USD continued its downward trajectory, with a fall of 0.50% to reach 0.5980. The inability of bulls to defend the 0.6000 level culminated in a slip to lows last seen in early May, subsequently affirming the currency pair's bearish bias.
The daily technical indicators further consolidate this downward trend. The Relative Strength Index (RSI) remains around 32, indicating sustained selling pressure from Friday's session. Furthermore, the Moving Average Convergence Divergence (MACD) continues to print rising red bars, thereby bolstering the growing bearish sentiment. However, the RSI stands near oversold terrain, so a correction might be on the horizon.
NZD/USD daily chart
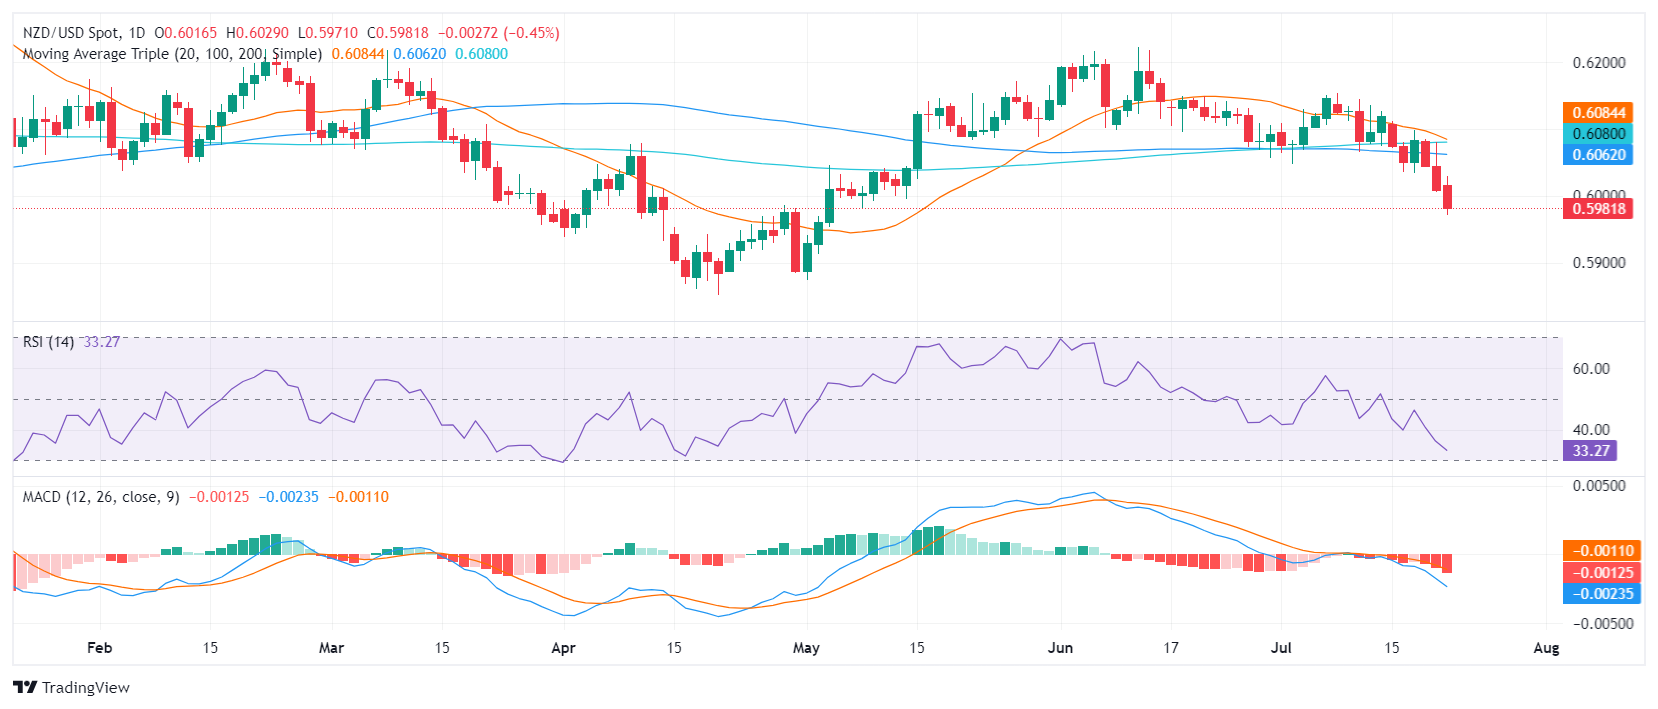
Resistance now lies at the former support level of 0.6000 and then around 0.6050. In contrast, potent support is currently noted at the 0.5980 line, below which resides the 0.5950-0.5930 range. Should the bearish inclination persist and cause a subsequent fall below these levels, it would strengthen the overall bearish narrative.