NZD/JPY Price Analysis: Bears conquer 100-day SMA and gain further ground
- Tuesday's trading session extended the NZD/JPY pair's downward trajectory.
- Losses were recorded in nine out of the past ten sessions, intensifying the bearish momentum.
- Sellers now have the advantage, having descended past the critical 100-day SMA.
In Tuesday's trading session, the NZD/JPY pair continued its fall and dipped to 92.60, marking a 1.30% drop. The pair has seen losses in nine out of the last ten sessions, boosting the bearish momentum significantly. Since the beginning of July, the cross has plunged by a massive 5%, now having dug its claws below the crucial 100-day Simple Moving Average (SMA).
Despite this seemingly relentless journey south, daily technical indicators languishing deep in oversold territory suggest a potential for an incoming correction. The Relative Strength Index (RSI) stands at 23, sinking further into oversold territory. Moreover, the Moving Average Convergence Divergence (MACD) continues to print rising red bars, indicating persistent selling pressure.
NZD/JPY daily chart
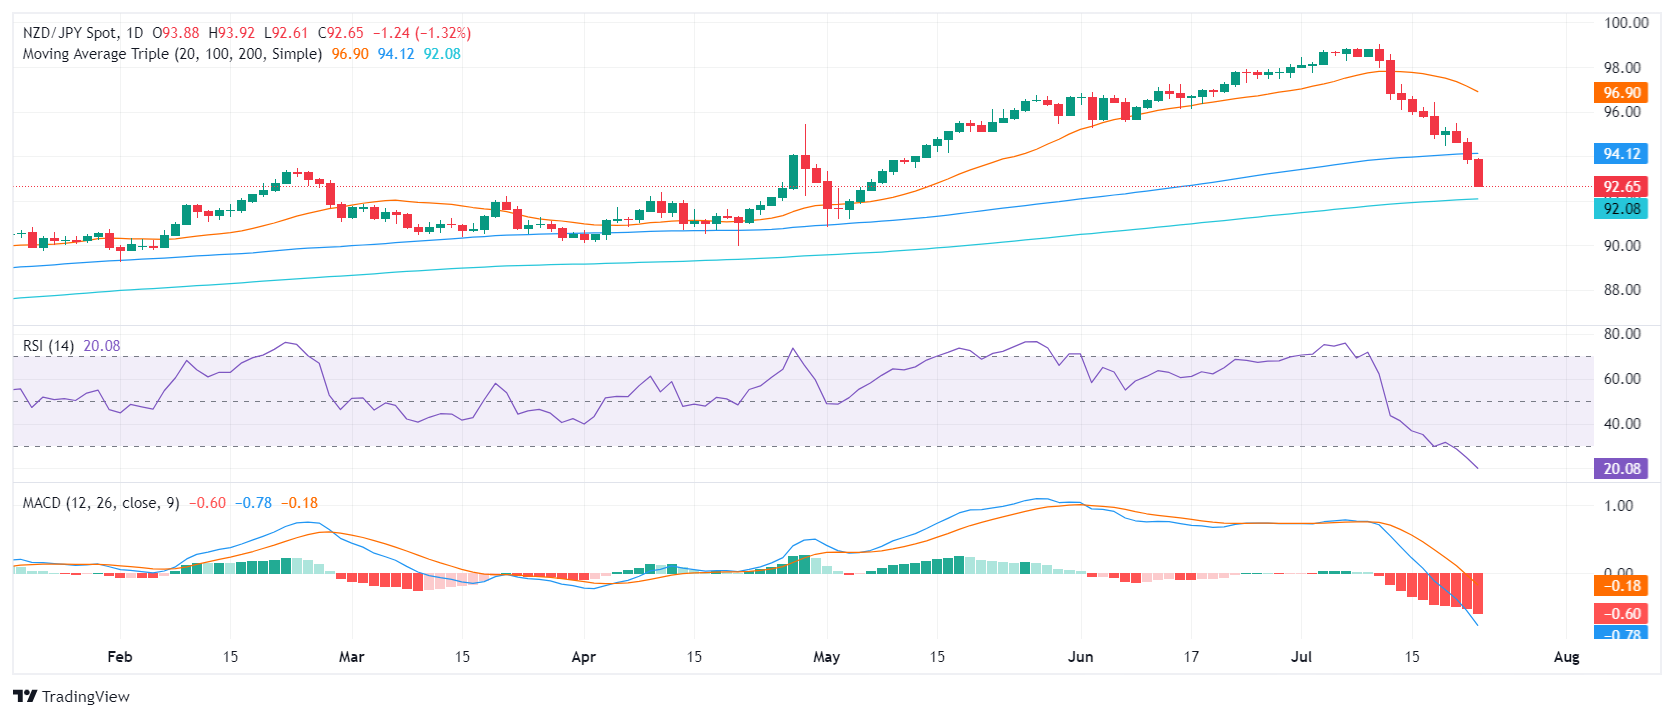
With the pair now below 93.00, bulls must present battle at 92.50 to avoid further losses with the 92.00 area around the 200-day SMA as the final barrier. On the flip side, resistance levels rest at the previous levels of 93.00, 93.50, and 94.00 (former supports).