EUR/GBP Price Analysis: Falling within shallow ascending channel
- EUR/GBP is declining within an ascending channel that has been rising since the end of August.
- The short-term trend is unclear although price continues respecting the boundaries of the channel.
EUR/GBP is falling within a shallow ascending recovery channel that began at the August 30 lows and the overall short-term trend is unclear.
The pair recently touched the top of the channel before pulling back down to the level of the 50-period Simple Moving Average (SMA).
EUR/GBP 4-hour Chart
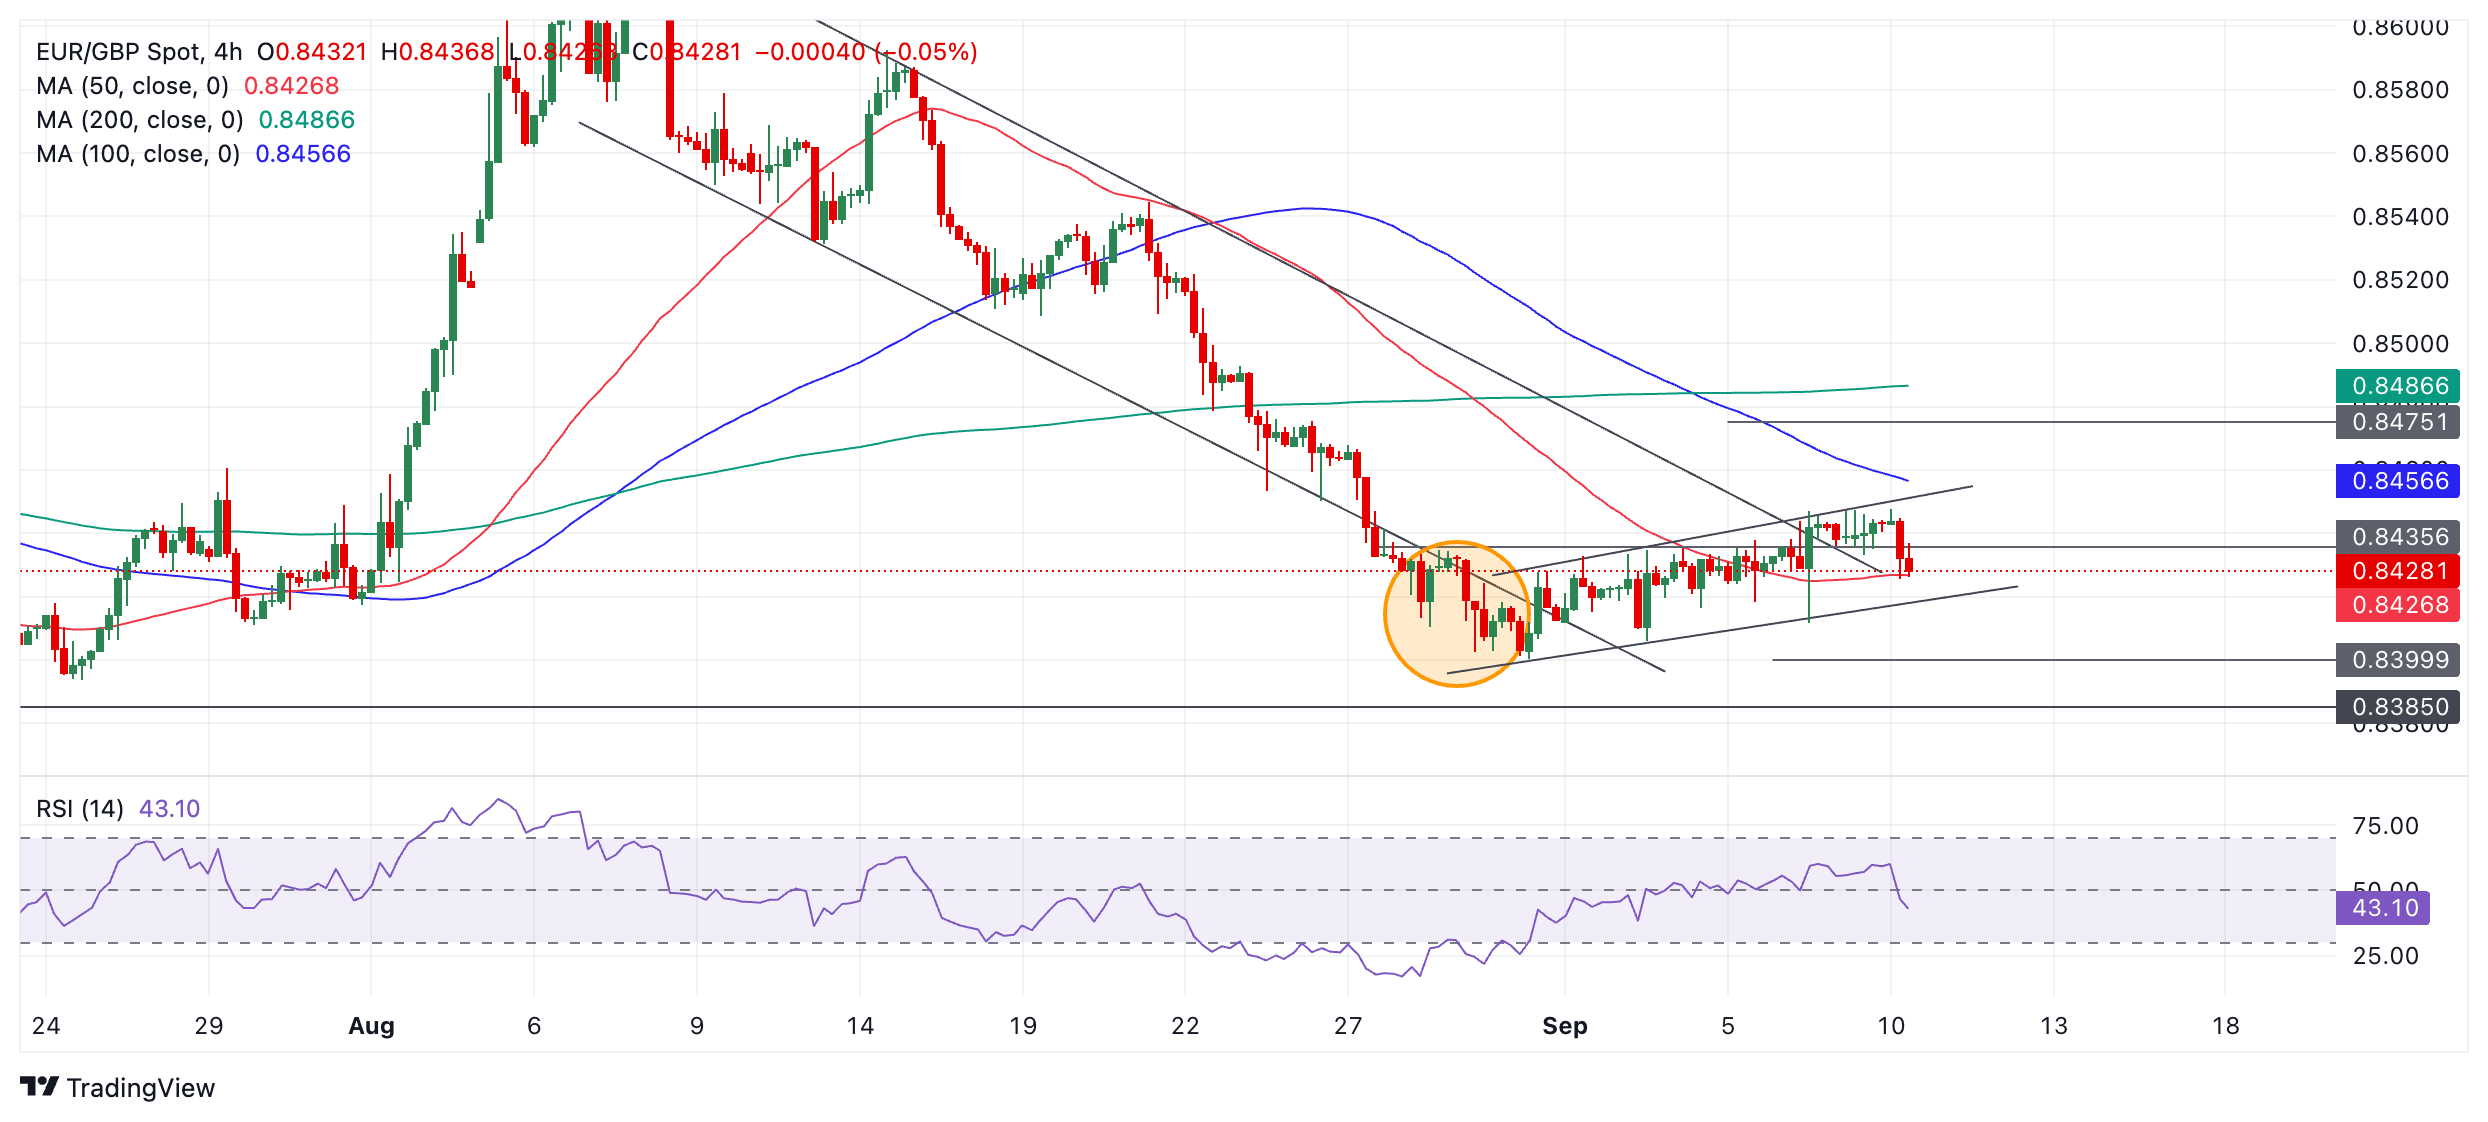
EUR/GBP is respecting the guard rails of the channel and it will probably find support at the lower channel line at roughly 0.8420 before rotating higher again and extending the channel steadily higher.
The medium-term trend is probably still bearish, however, suggesting a risk of price breaking out lower.
A break below 0.8406 (September 3 low) would pave the way for further weakness to a downside target at 0.8385 (July 17 lows).
The break above the 50-period SMA was a bullish sign as was the breakout from the falling channel during August (orange shaded circle) when it accelerated to the downside. This could have been an exhaustion break. If so, it would be a bullish sign as these patterns usually happen at the end of trends and are a sign of reversal.
A clear break above the top of the shallow rising channel at roughly 0.8455 would be required to confirm a bullish reversal. Such a move could be expected to reach 0.8470-80 as an initial target zone.