Silver Price Prediction: Reaches top of long-term range
- Silver has reached the top of a long-term range.
- It is at risk of pulling back although price action remains quite bullish.
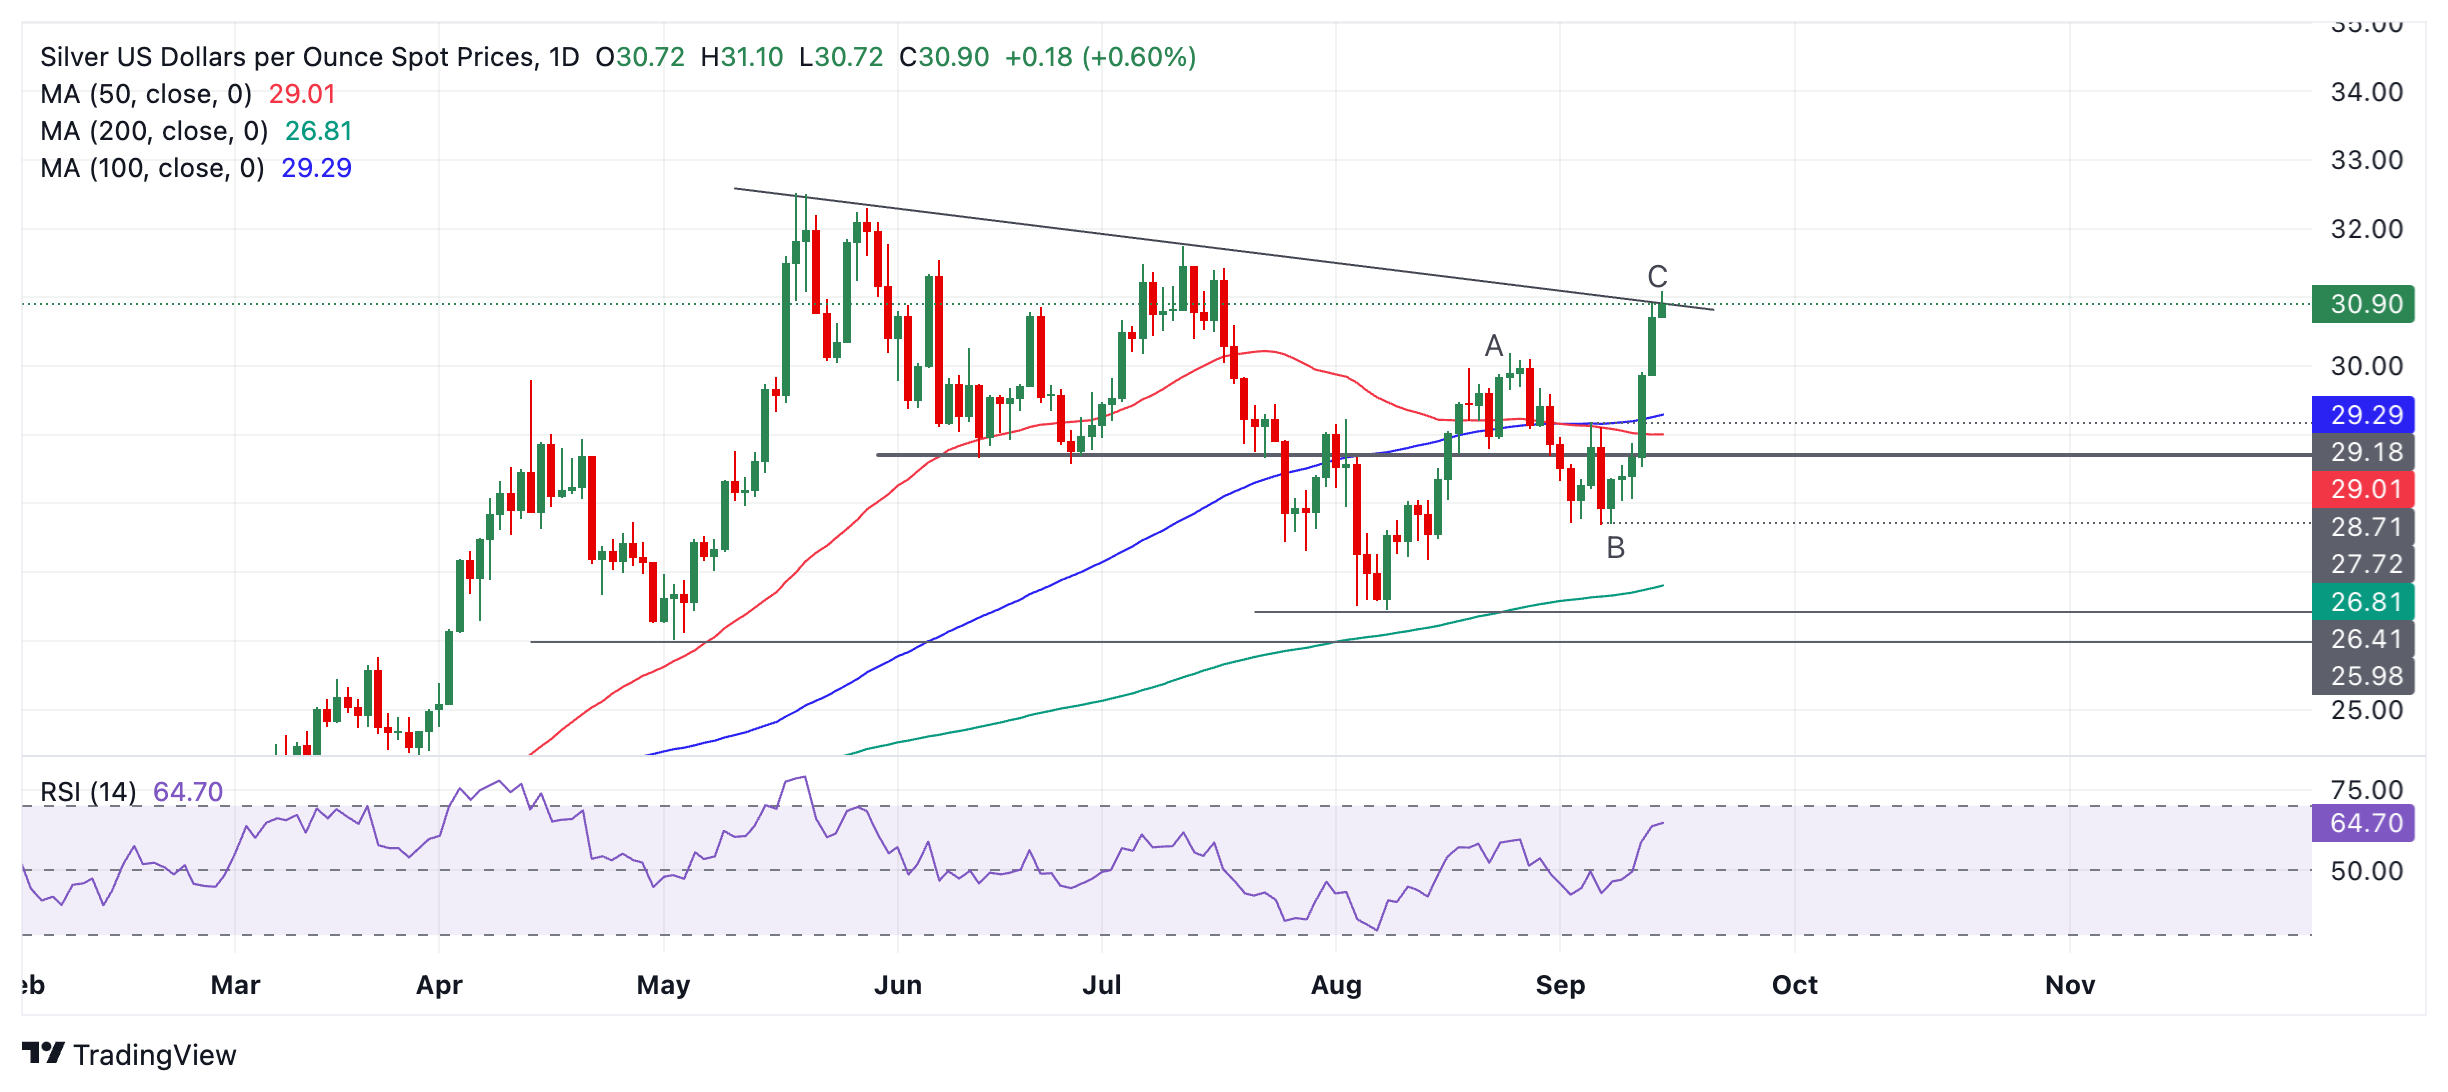
Silver (XAG/USD) has reached the top of a broad range that stretches from the $26s to the $30s.
It has just tested firm resistance from the top of the range and is at risk of pulling back.
Silver 4-hour Chart
Silver has formed a Measured Move price pattern since the August 8 low. Such patterns consist of three waves in a zig-zag pattern, with waves A and C usually of a similar length. In the case of Silver, A and C are of a similar length, adding credence to the theory price may correct back.
The Relative Strength Index (RSI) momentum indicator is rising in line with price, however, which is mildly supportive of the bullish short-term trend. Given it is a principle of technical analysis that “the trend is your friend” there is a chance Silver could bypass resistance from the top of the range and continue higher. A decisive break above the range ceiling would confirm such a breakout and lead to probable move up to $32.94, the 0.618 Fibonacci ratio of C leg extended higher.
A decisive break would be one accompanied by a long green candlestick that broke clearly above the level and closed near its high, or three candlesticks in a row that broke above the level.
Currently there are no signs from price action that Silver is about to correct back – only the resistance line drawn on the chart. A reversal candlestick pattern, however, such as a Shooting Star or Hanging Man, for example, would substantially increase the odds of a pull back evolving. Such a move would probably find firm support at the $30.00 level, the top of wave A.

