17 Sep 2024
EUR/GBP Price Forecast: Breakdown from channel could follow-through lower
- AUD/USD has broken above a trendline and established a new short-term uptrend.
- It will probably extend to the August highs.
AUD/USD has begun a new leg higher after bottoming out on September 11. This new leg has broken above a key trendline for the correction of the August rally – a bullish sign – which, amongst other things, suggests it is now in a short-term uptrend.
AUD/USD Daily Chart
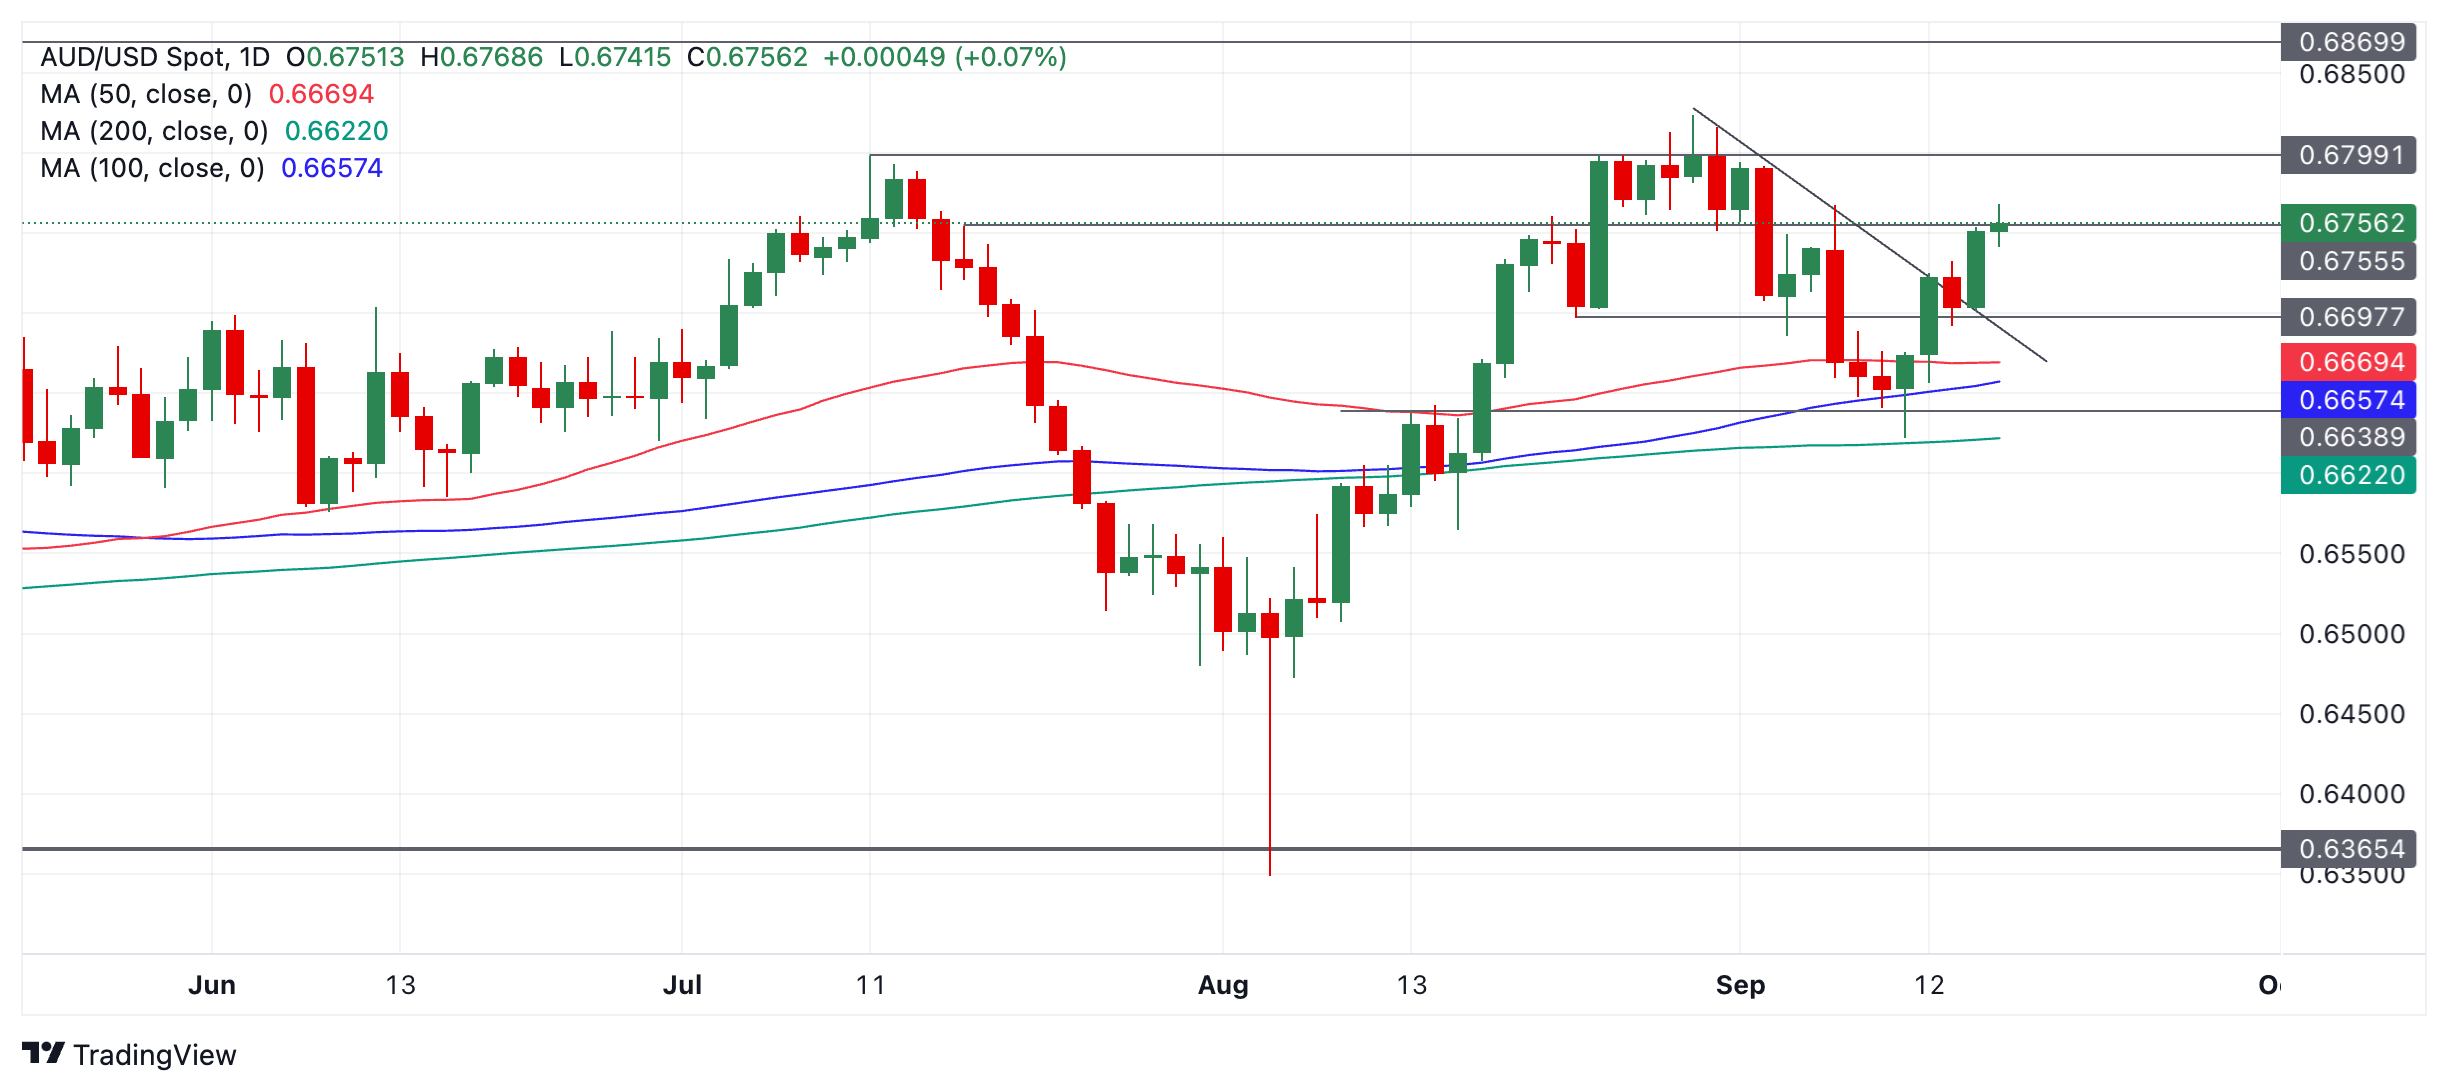
It is a principle of technical analysis that “the trend is your friend” which suggests the Aussie is likely to continue higher. It will probably match or almost match the 0.6824 August 29 high. The resistance level at 0.6799 ( July high) might, however, slow it down along the way.
Momentum, as measured by the Relative Strength Index (RSI) is mirroring price, a fact that is supportive of the current mini-rally.