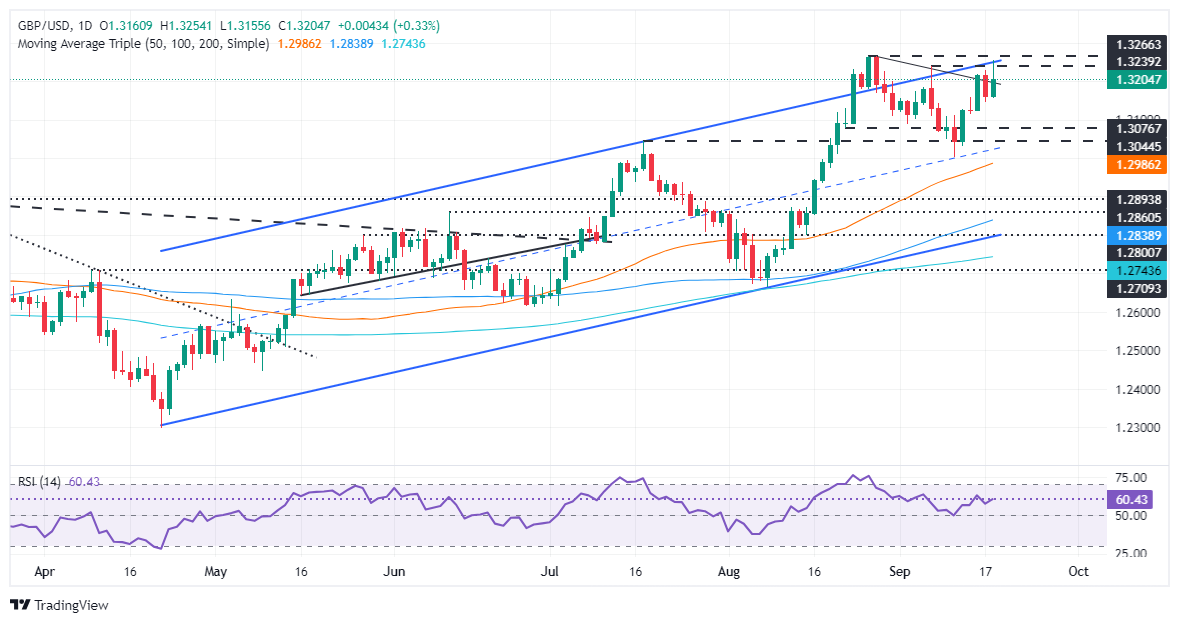
GBP/USD Price Forecast: Retreats from three-week high, holds to gains above 1.3200
- GBP/USD bias remains bullish, with the RSI favoring buyers, though profit-taking ahead of the Fed decision limits further gains.
- A 25-bps Fed rate cut could see GBP/USD fall toward support at 1.3200, 1.3151, and 1.3100, with a potential retest of 1.3001.
- A 50-bps cut could push GBP/USD above 1.3300, targeting the March 2022 high of 1.3437.
The Pound Sterling posted modest gains during the North American session, hitting a three-week high of 1.3254, but failed to gain traction as traders braced for the Federal Reserve’s monetary policy decision. Therefore, GBP/USD traders dragged the exchange rate toward 1.3205, still above its opening price by 0.30%.
GBP/USD Price Forecast: Technical outlook
The GBP/USD bias is bullish, though it has failed to break to new yearly highs due to a possible change of scenario. At the time of writing, the Relative Strength Index (RSI) favors buyers, while price action hints they-‘re booking profits ahead of the Fed.
If Powell and Co. decide to cut rates by 25 basis points (bps), further downsides will be seen in the GBP/USD. This will put into play the 1.3200 figure and the daily low of 1.3151. If those levels are taken out, the next support would be 1.3100 ahead of the latest cycle low at 1.3001, the September 11 low.
On the other hand, a 50-bps cut could cause the GBP/USD to climb past 1.3300, opening the door to testing the March 1, 2022 peak at 1.3437.
GBP/USD Price Action – Daily Chart
British Pound PRICE Today
The table below shows the percentage change of British Pound (GBP) against listed major currencies today. British Pound was the strongest against the US Dollar.
| USD | EUR | GBP | JPY | CAD | AUD | NZD | CHF | |
|---|---|---|---|---|---|---|---|---|
| USD | -0.04% | -0.34% | -0.31% | -0.05% | -0.18% | -0.39% | -0.20% | |
| EUR | 0.04% | -0.32% | -0.28% | -0.01% | -0.14% | -0.36% | -0.16% | |
| GBP | 0.34% | 0.32% | 0.02% | 0.30% | 0.18% | -0.05% | 0.18% | |
| JPY | 0.31% | 0.28% | -0.02% | 0.28% | 0.15% | -0.05% | 0.16% | |
| CAD | 0.05% | 0.00% | -0.30% | -0.28% | -0.13% | -0.35% | -0.12% | |
| AUD | 0.18% | 0.14% | -0.18% | -0.15% | 0.13% | -0.20% | 0.03% | |
| NZD | 0.39% | 0.36% | 0.05% | 0.05% | 0.35% | 0.20% | 0.20% | |
| CHF | 0.20% | 0.16% | -0.18% | -0.16% | 0.12% | -0.03% | -0.20% |
The heat map shows percentage changes of major currencies against each other. The base currency is picked from the left column, while the quote currency is picked from the top row. For example, if you pick the British Pound from the left column and move along the horizontal line to the US Dollar, the percentage change displayed in the box will represent GBP (base)/USD (quote).

