Gold hovers close to new high of $2,600 after Fed meeting
- Gold shot higher after the Federal Reserve cut interest rates by a double-dose of 50 bps.
- The precious metal failed to hang onto gains and topples before recovering again on Thursday.
- Gold’s limited upside could be due to the Fed’s general assessment of the US economy as doing fine.
Gold (XAU/USD) edges higher and trades back in the $2,580s on Thursday after falling to the $2,540s following the US Federal Reserve (Fed) decision on interest rates the prior day.
The yellow metal popped to a new record high of $2,600 on Wednesday before quickly falling back following the much-anticipated Fed meeting, at which they decided to implement a 50 basis point (0.50%) cut to the fed funds rate. This lowers the Fed’s base rate to a range of 4.75%-5.25% from 5.25%-5.50% previously.
Gold peaks after Fed meets
Gold hit a record high of $2,600 after the Fed went ahead with a 50 bps rate cut on Wednesday, although the yellow metal failed to sustain its new highs. Several analysts explained the lack of volatility (financial asset prices changed only modestly after the announcement) due to the Fed’s easing cycle having already been priced in by financial markets ahead of the event.
“Is the easing cycle already priced in?” opined Thomas Mathews, Head of Markets, Asia Pacific for Capital Economics in a note on Thursday. “Markets barely reacted to the Fed’s 50 bps rate cut, on balance, and our base case is that further cuts won’t move the needle too much either.”
Gold upside may have been capped by the basically clean bill of health assigned to the US economy by the Fed. Gross Domestic Product (GDP) growth forecasts were only slightly revised down to 2.0% in 2024 from 2.1% previously and is expected to remain at that level until the end of 2027.
“Accompanying the larger cut was a signal of a fundamentally strong (US) economy with no suggestion that continued 50 bps cuts were likely,” said Jim Reid, Global Head of Research at Deutsche Bank. “Growth projections were little changed and the dot plot showed the median FOMC member expecting the fed funds range at 4.25-4.50% at year-end.”
Weaknesses in the labor market now appear to be the Fed’s major concern. The central bank revised up its Unemployment Rate forecast to 4.4% in 2024-2025 and only sees this falling back to 4.2% by the end of 2027. The focus for markets from here on, therefore, is likely to be on how well the labor market holds up.
But even the labor situation is not yet dire enough to give Gold a haven boost.
“Jobless Claims are actually still at very low levels, nothing like what you would see in a recession, and even quits’ rates and JOLTS’ rates are still stronger than they have been over the course of the last ten years,” said Janet Henry, Global Chief Economist at HSBC. The higher Unemployment Rate was partially due to high immigration in the US, she added, rather than inherent weakness.
Labor market metrics are a lagging indicator, said Henry, so there was a risk of unpleasant surprises ahead.
“If we get a shocking payrolls in November then we might be back to talking about another 50 bps cut,” said the economist in the interview with Bloomberg News.
Technical Analysis: Gold recovering after pullback
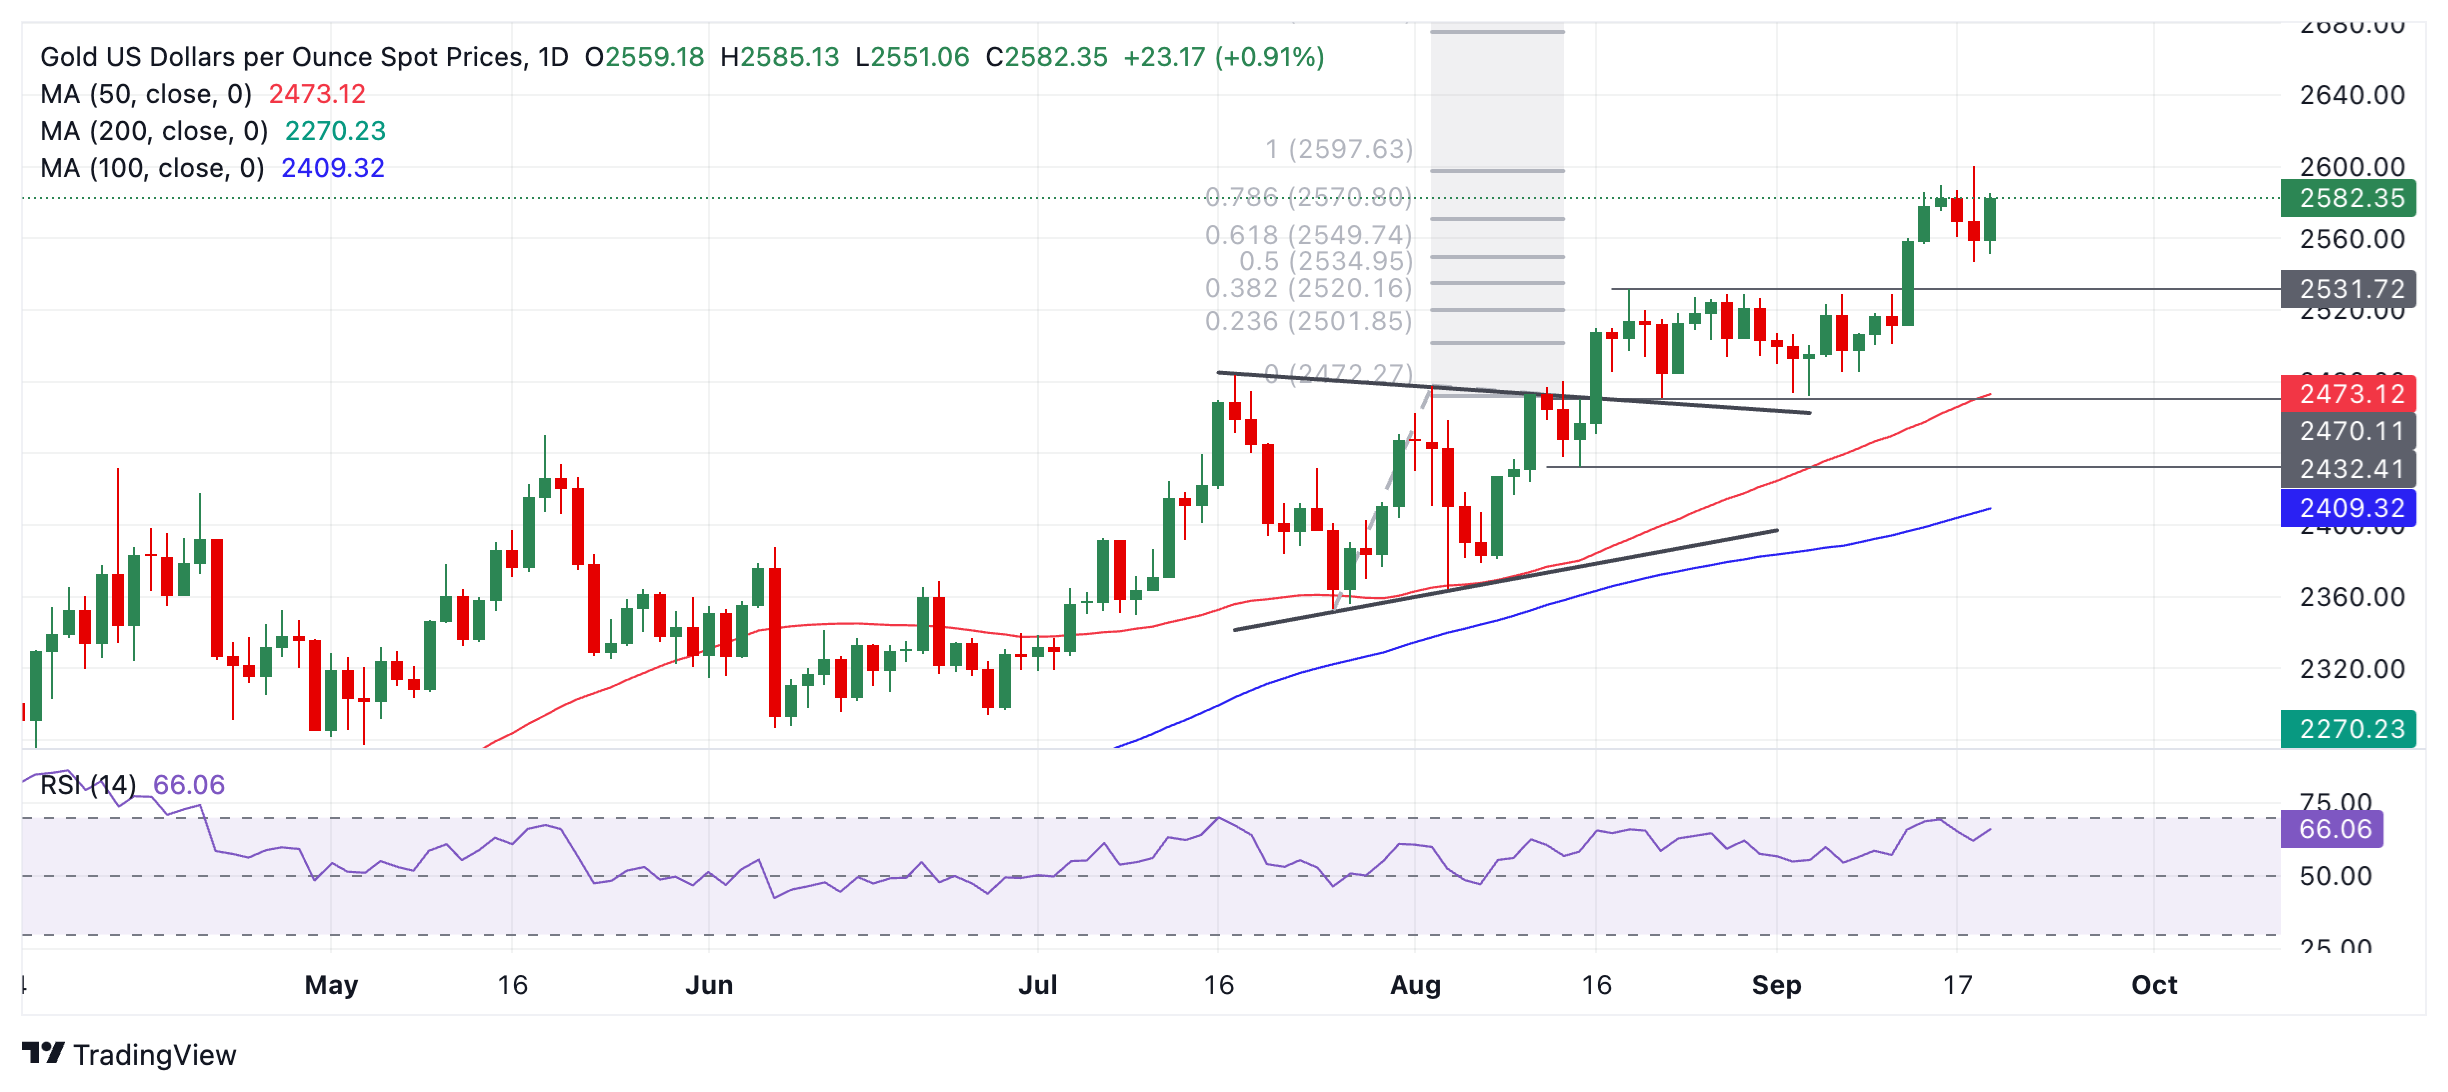
Gold is recovering after a volatile 24-hour period in which it shot up to a new high of $2,600 but then fell back down to a low in the $2,540s. It is now rebounding from the low and is already almost a percentage point higher on the day at the time of writing on Thursday.
Based on the technical analysis dictum that “the trend is your friend,” the odds favor more upside in line with the dominant long, medium, and short-term uptrends.
It is possible Gold’s correction could have further to go, but the overall current is drifting higher.
XAU/USD Daily Chart
Gold is still not overbought in the daily chart, according to the Relative Strength Index (RSI), which also leaves room for more upside.
If it breaks above $2,600, it will print a higher high and confirm the uptrend is continuing. The next target above that would be round numbers: $2,650 and then $2,700.
In the event that Gold’s RSI enters the overbought zone on a closing basis, however, it will advise traders not to add to their long positions.
If it enters and then exits overbought, it will be a sign to close longs and sell as it would suggest a deeper correction is in the process of unfolding.
If the correction extends, firm support lies at $2,550, $2,544 (0.382 Fibonacci retracement of the September rally), and $2,530 (former range high).
Economic Indicator
Fed Interest Rate Decision
The Federal Reserve (Fed) deliberates on monetary policy and makes a decision on interest rates at eight pre-scheduled meetings per year. It has two mandates: to keep inflation at 2%, and to maintain full employment. Its main tool for achieving this is by setting interest rates – both at which it lends to banks and banks lend to each other. If it decides to hike rates, the US Dollar (USD) tends to strengthen as it attracts more foreign capital inflows. If it cuts rates, it tends to weaken the USD as capital drains out to countries offering higher returns. If rates are left unchanged, attention turns to the tone of the Federal Open Market Committee (FOMC) statement, and whether it is hawkish (expectant of higher future interest rates), or dovish (expectant of lower future rates).
Read more.Last release: Wed Sep 18, 2024 18:00
Frequency: Irregular
Actual: 5%
Consensus: 5.25%
Previous: 5.5%
Source: Federal Reserve

