AUD/USD Price Forecast: Posts new high for 2024 but diverging bearishly with RSI
- AUD/USD has posted a new high for the year, and could extend higher.
- It is showing bearish divergence with RSI so there is a risk of a pull back evolving.
AUD/USD reaches a new high for 2024 at 0.6839 on Thursday, after the leg higher that began at the September 11 lows extends. It has since edged back down marginally to just above the 0.6800 mark.
AUD/USD Daily Chart
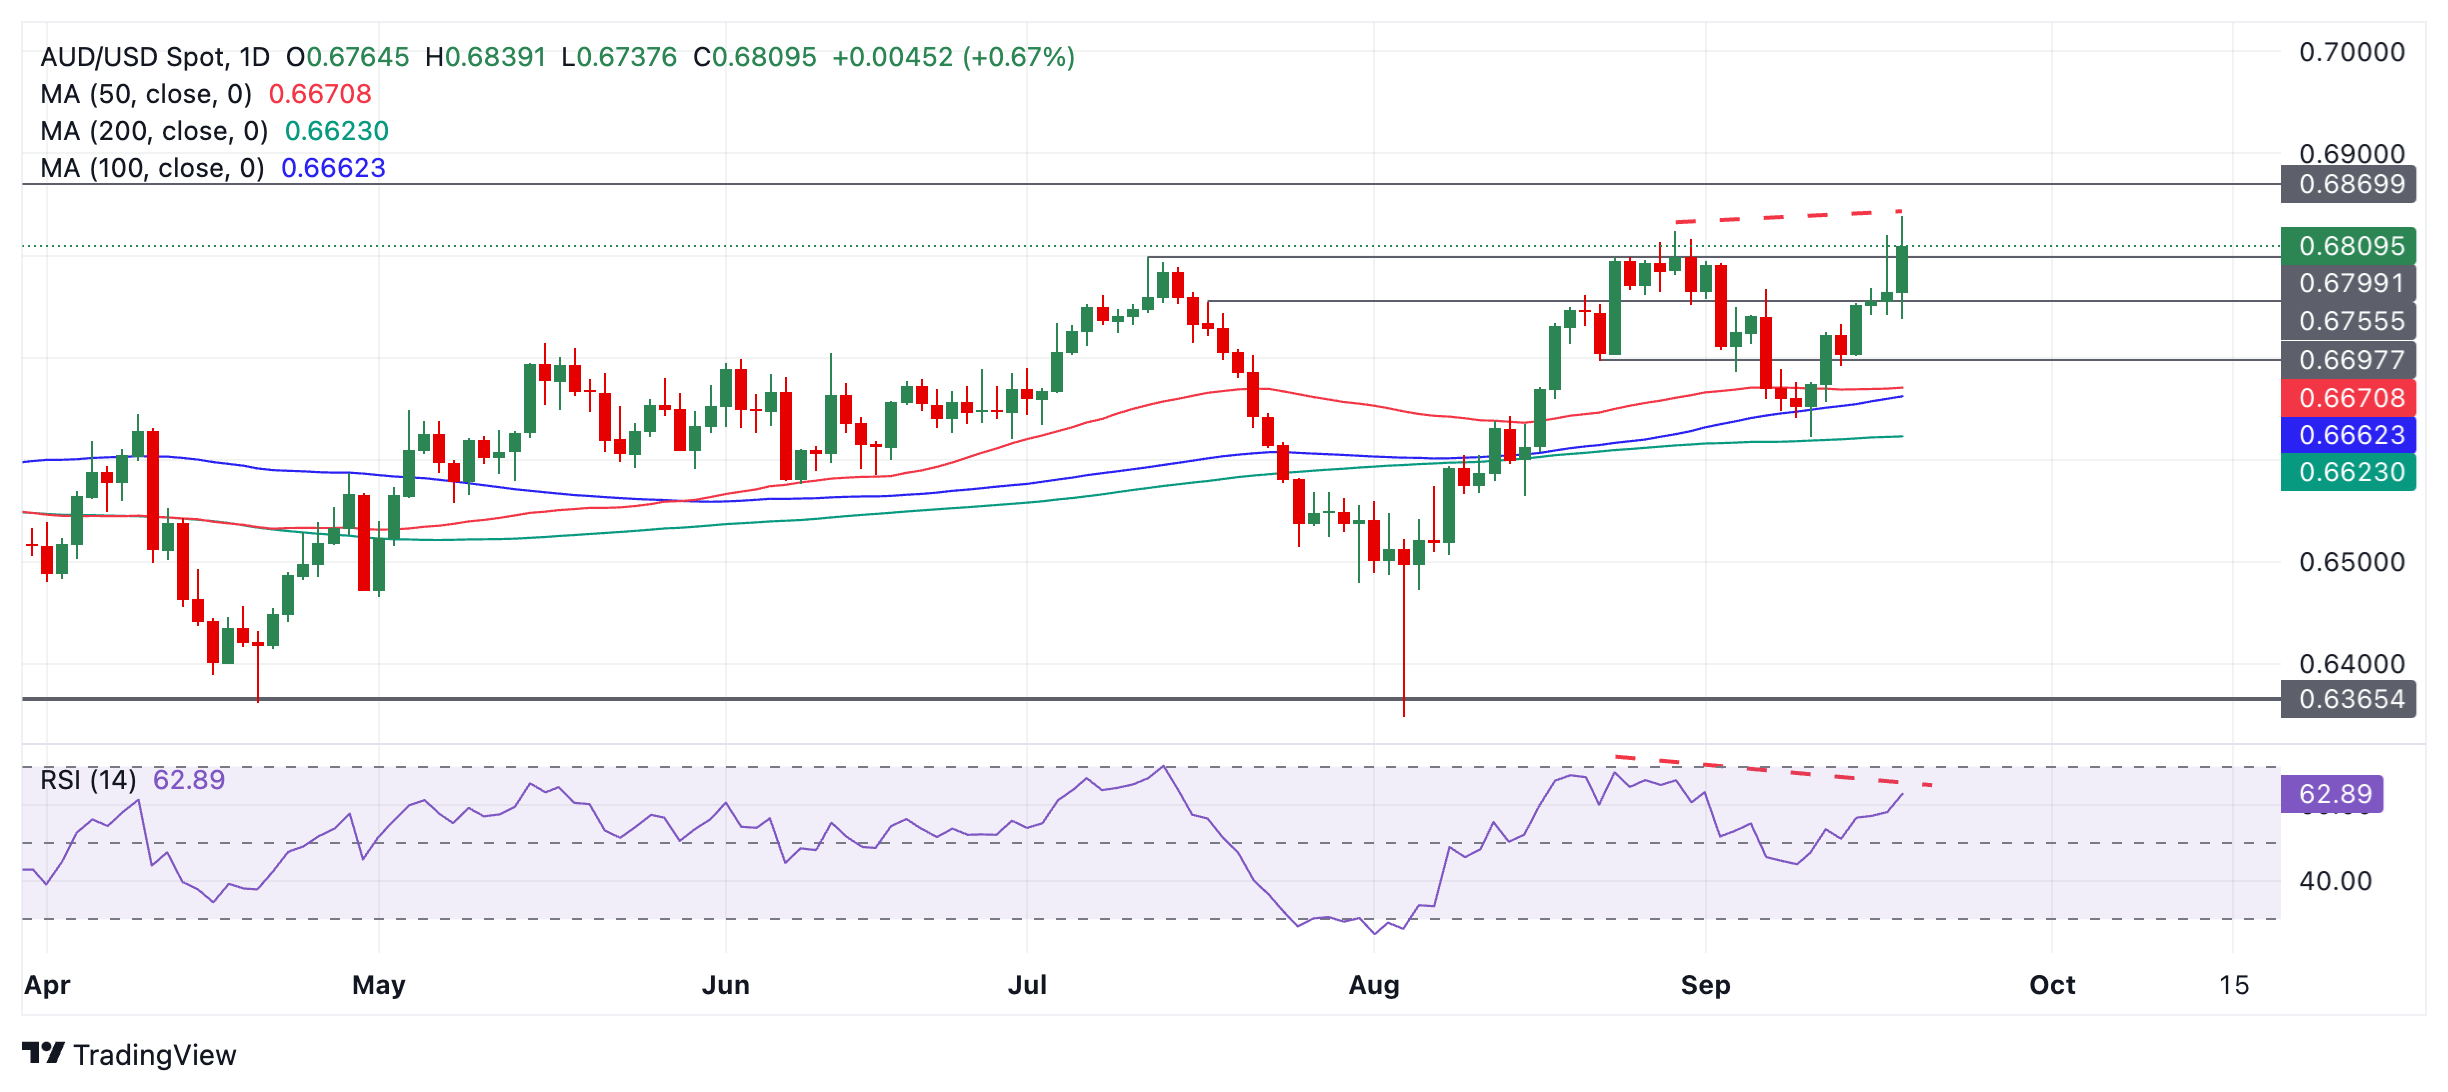
Price is showing mild bearish divergence with the Relative Strength Index (RSI) momentum indicator (red dashed lines on chart above). This happens when the price reaches a new high but the RSI does not. The non confirmation is a bearish sign as it indicates mild underlying weakness. It suggests AUD/USD is at risk of pulling back.
If a correction evolves it is likely to find support at around 0.6800 (July high), 0.6755 or 0.6698 (August 22 swing low).
AUD/USD is in a short-term uptrend, however, since the September 11 low and given it is a principle of technical analysis that “the trend is your friend” it will probably continue higher eventually – despite the bearish divergence with RSI. A break above the 0.6839 yearly high would confirm a continuation of the uptrend to a target at the 0.6870 level (December 2023 high).