USD/CHF Price Prediction: Unfolding bullish leg within range
- USD/CHF has been oscillating since late August.
- It is currently unfolding a bullish leg within that sideways trend.
USD/CHF is trading within a range which began forming after the August lows. It is currently rising up within that range in a bullish leg which has reached about the midpoint of the consolidation.
USD/CHF 4-hour Chart
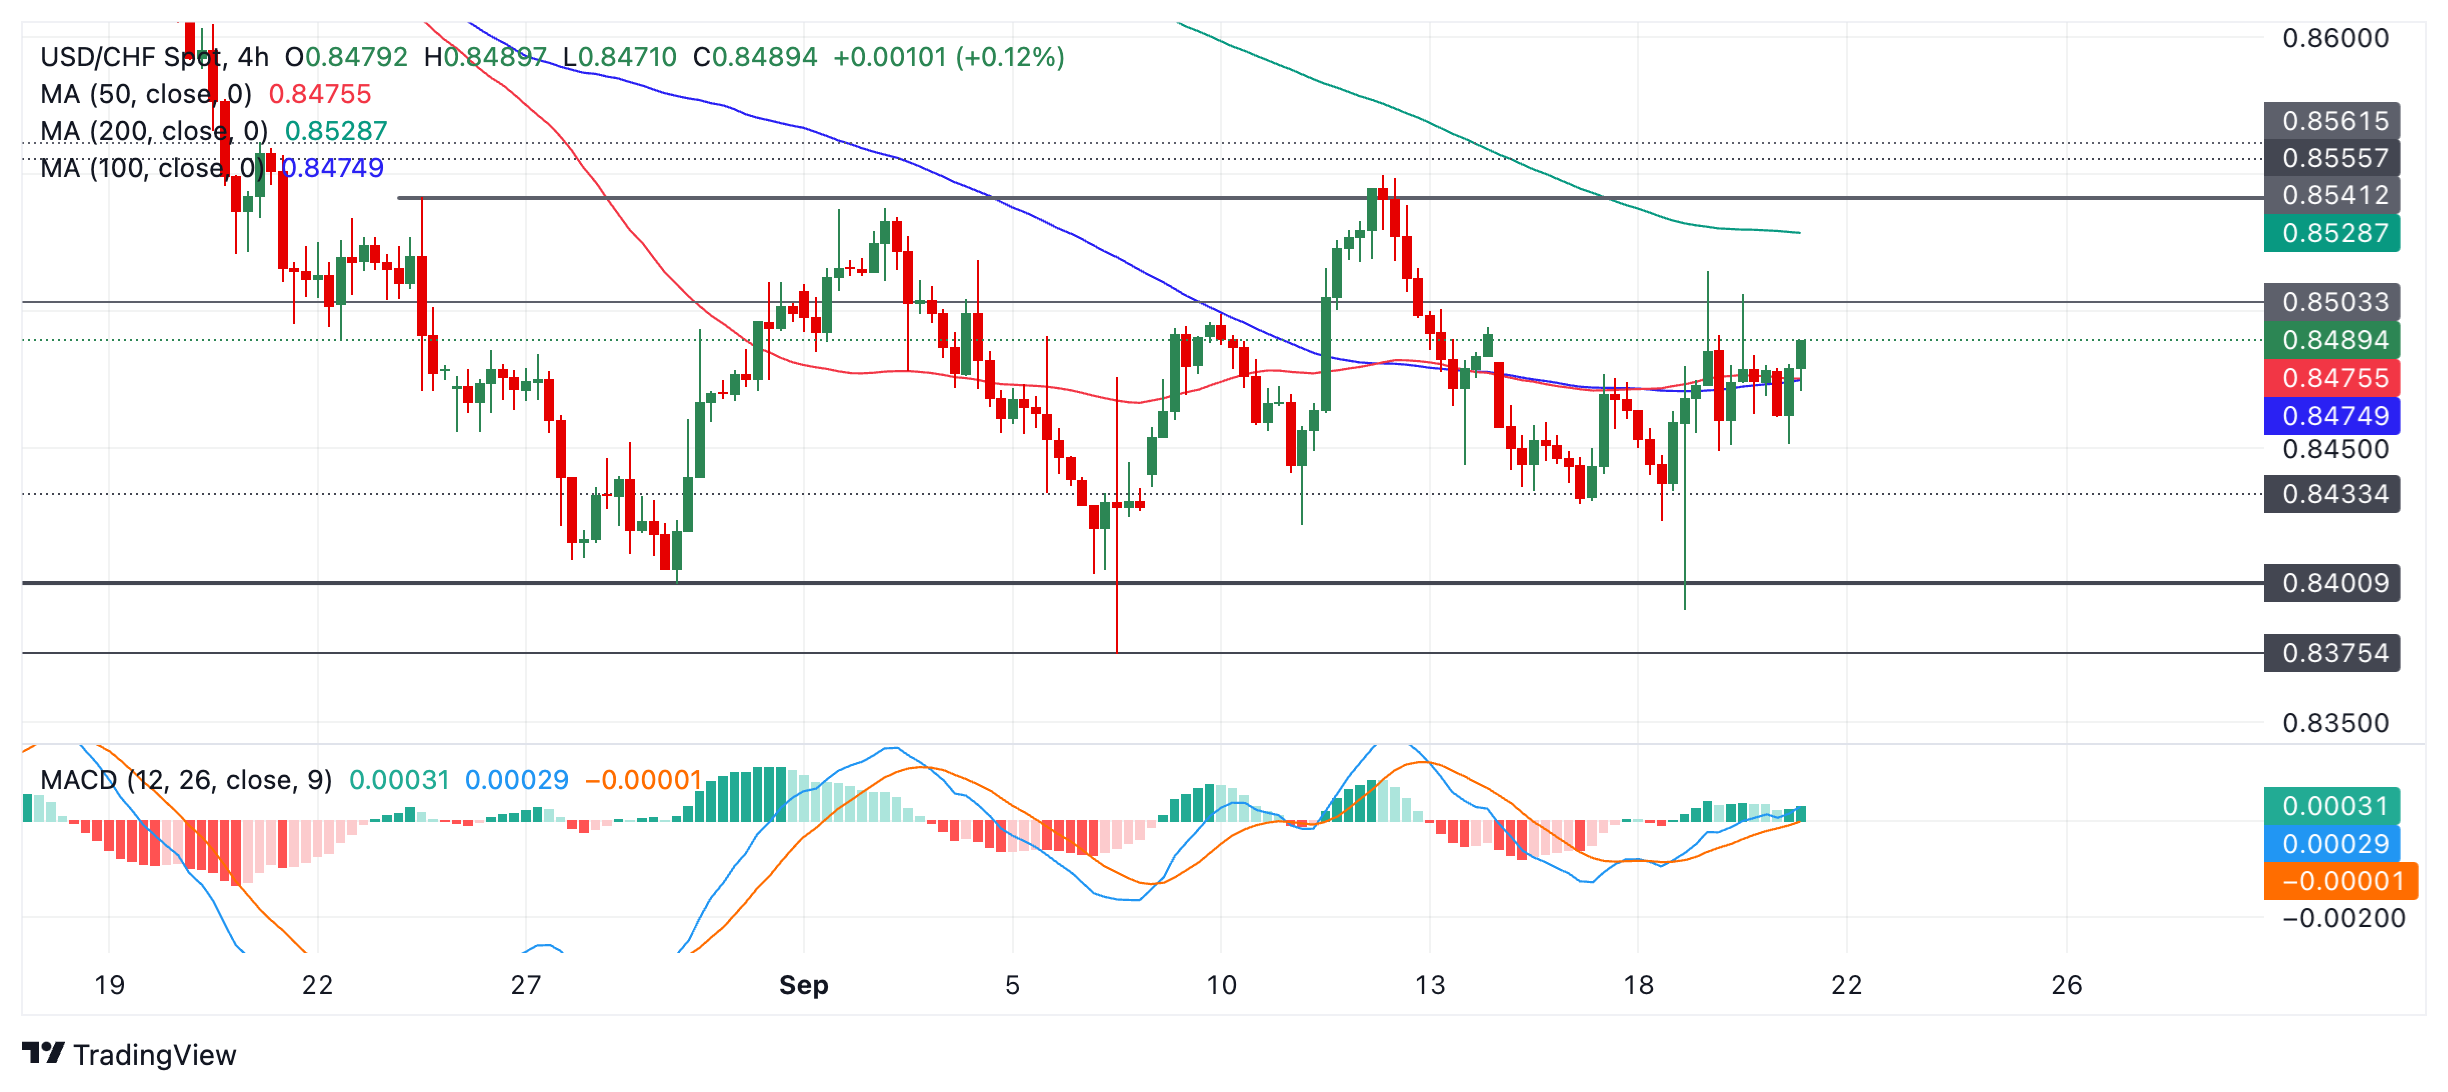
USD/CHF is not in a bullish or bearish trend in the short-term but rather probably a sideways trend. Since it is a principle of technical analysis that “the trend is your friend” the odds favor a continuation of this trend. This suggests the current move up will probably continue until it reaches the range highs before rotating down and continuing the sideways oscillation.
The Moving Average Convergence Divergence (MACD) momentum indicator has risen above zero which is a bullish sign and suggests a continuation of the up move.
A break above 0.8515 (September 19 high) would probably provide confirmation of a continuation higher towards the range high at 0.8541.