NZD/JPY Price Analysis: Consolidation remains, slight upward bias
- NZD/JPY is trading within a range, bounded by 90.10 and 91.60.
- RSI is slightly rising in positive territory, MACD declining but still positive.
- A clear direction is lacking, but a potential upside breakout could take place.
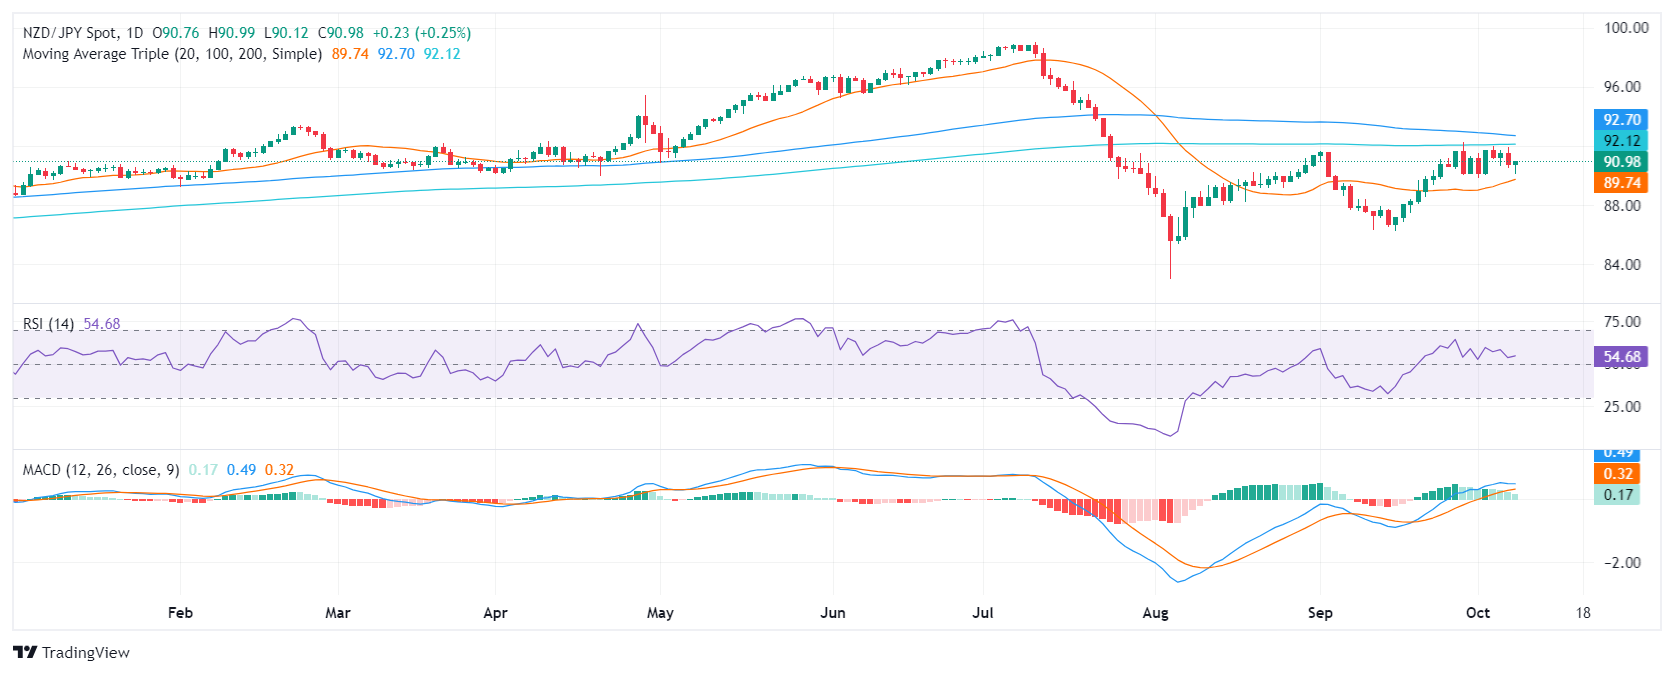
The NZD/JPY pair continues moving sideways on Wednesday, extending the consolidation of the past week. The pair is currently trading at 91.00, with 0.30% gains and a slight upward bias. The pair remains trapped within the range defined by the 90.00 support and the 91.00 resistance, with indicators showing a lack of clear direction.
The technical indicators provide a mixed picture. The Relative Strength Index (RSI) is at 55, in the positive terrain, and has a slightly rising slope, indicating that buying pressure is steady. However, the Moving Average Convergence Divergence (MACD) is green and decreasing, suggesting that buying pressure is weak.
The overall outlook is slightly bullish due to the pair's position above the 20-day Simple Moving Averages (SMA). However, caution is advised as the MACD shows signs of weakening which could lead to a bearish leg. The main support level is the 90.00 area (20-day SMA) which in case of being lost could ignite a drop to the 88.00-87.00 range. On the other hand, the main resistance to conquer is the 91.00 area which could fuel a rise towards 91.60.
NZD/JPY daily chart

