The Australian Dollar rises on renewed optimism, US PPI data awaited
- The Australian Dollar strengthens amid renewed optimism, spurred by Trump's openness to further trade negotiations.
- Australia’s Consumer Confidence marked a third consecutive monthly increase in July, signalling an improved consumer outlook.
- President Trump is set to impose tariffs exceeding 10% on smaller countries, including several in Africa and the Caribbean.
The Australian Dollar (AUD) advances against the US Dollar (USD) on Wednesday, halting its three-day losing streak. The AUD/USD pair appreciates as the US Dollar edges lower amid renewed optimism, driven by US President Donald Trump's willingness to further engage in trade discussions. Trump indicated the possibility of negotiating with the European Union (EU) and other key trading partners, which would ease investor concerns over an escalating trade dispute.
University of Melbourne (UoM) released Westpac Consumer Confidence on Tuesday, which climbed 0.6% month-over-month in July, following a 0.5% gain in June. This marked a third consecutive monthly increase, signaling a modest yet encouraging improvement in consumer outlook.
Traders await Thursday’s jobs report from the Australian Bureau of Statistics, with Employment Change expecting 20,000 jobs added in June. Moreover, the Unemployment Rate is expected to remain steady at 4.1%.
The AUD could face challenges as markets expect an 80% chance of a Reserve Bank of Australia (RBA) rate cut in August. Markets also expect a 75-basis-point rate cut by early 2026. However, RBA Governor Michele Bullock stated that inflation risks persist, citing the elevated unit labor costs and weak productivity as factors that could drive inflation above current projections.
Australian Dollar edges higher as US Dollar mutes ahead of PPI data
- The US Dollar Index (DXY), which measures the value of the US Dollar against six major currencies, is edging lower and trading at around 98.50 at the time of writing. Traders await the US Producer Price Index (PPI) later on Wednesday, followed by the Fed Beige Book and Industrial Production.
- The Associated Press reported that US President Donald Trump is preparing to introduce over 10% tariffs on smaller countries, including nations in Africa and the Caribbean. "We'll probably set one tariff for all of them," Trump told reporters on Tuesday.
- The US Consumer Price Index (CPI) rose 2.7% year-over-year in June, matching market expectations. Core CPI came in at 2.9%, just below the 3.0% forecast but still notably above the Federal Reserve’s 2% target. The hotter-than-expected June inflation figures reignited concerns about prolonged high Fed interest rates.
- US President Donald Trump has threatened to impose “very severe” tariffs on Russia if no peace deal is reached within 50 days. Trump also warned of secondary tariffs on countries importing Russian Oil. Moreover, Trump, alongside NATO Secretary-General Mark Rutte, confirmed that European allies will purchase billions of dollars’ worth of American-made weapons, such as Patriot missile systems. These weapons will be transferred to Ukraine in the coming weeks to tackle intensified Russian attacks.
- The US government immediately imposed a 17% duty on Monday on most imports of fresh tomatoes from Mexico after negotiations ended without an agreement to avert the tariff. Trump announced, on Saturday, a 30% tariff on imports from the European Union (EU) and Mexico starting August 1. He also proposed a blanket tariff rate of 15%-20% on other trading partners, an increase from the current 10% baseline rate. In response, the European Union announced on Sunday that it will extend its pause on retaliatory measures against US tariffs until early August, in hopes of reaching a negotiated agreement.
- The US government posted a $27 billion budget surplus in June, fueled by a surge in customs duties revenue, which reached a record $27.2 billion. This jump in tariff collections, largely stemming from policies introduced during the Trump administration, contributed to a 13% increase in total budget receipts, which rose to $526 billion. Meanwhile, federal spending declined by 7% to $499 billion.
- Chinese economy expanded at an annual rate of 5.2% in the second quarter, compared to a 5.4% growth in the first quarter and the expected 5.1% growth. Meanwhile, the Chinese Gross Domestic Product (GDP) rate rose 1.1% in Q2, against the market consensus of a 0.9% increase. Moreover, Retail Sales increased by 4.8% YoY in June, against the 5.6% expected and 6.4% prior, while Industrial Production came in at 6.8%, against the 5.6% expected.
- The National Bureau of Statistics (NBS) shared its economic outlook during its press conference, stating that overall economic performance in the first half of the year was stable, with steady progress. However, it emphasized the need to improve investment structure and the environment. It also added that the real estate market is heading towards stabilization.
Australian Dollar rebounds toward nine-day EMA near 0.6550
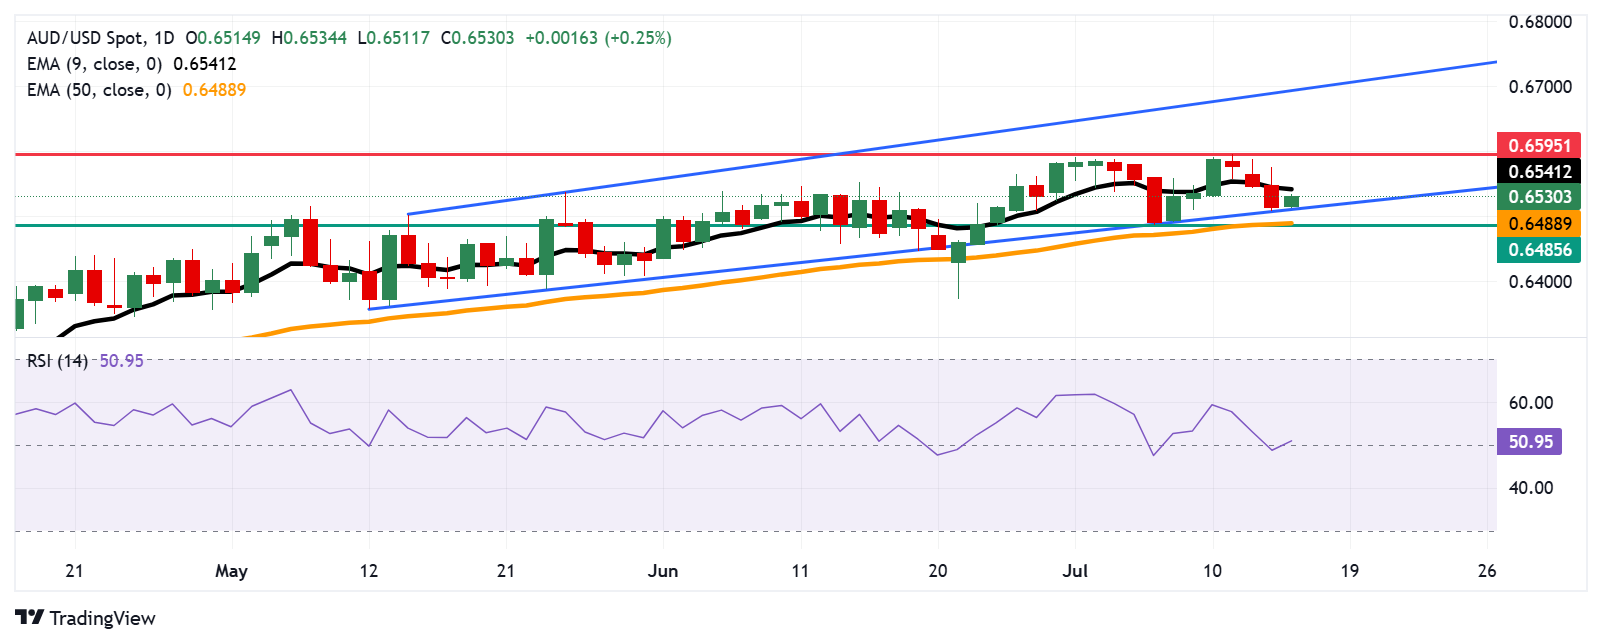
The AUD/USD pair is trading around 0.6530 on Wednesday. The daily chart’s technical analysis indicated a persistent bullish sentiment as the pair is positioned within the ascending channel pattern. The 14-day Relative Strength Index (RSI) hovers around the 50 mark, suggesting that market bias is neutral. However, the pair moved below the nine-day Exponential Moving Average (EMA), indicating that short-term price momentum is weakening.
On the upside, the AUD/USD pair could test the nine-day EMA at 0.6541. A break above this level could strengthen the short-term price momentum and support the pair to approach the eight-month high of 0.6595, which was reached on July 11. Further advances would strengthen the bullish bias and prompt the pair to explore the region around the upper boundary of the ascending channel around 0.6700.
The AUD/USD pair is testing the ascending channel’s lower boundary around 0.6510. A break below the channel would weaken the short-term price momentum and put downward pressure on the pair to navigate the area around the 50-day EMA at 0.6488, aligned with the three-week low at 0.6485.
AUD/USD: Daily Chart
Australian Dollar PRICE Today
The table below shows the percentage change of Australian Dollar (AUD) against listed major currencies today. Australian Dollar was the strongest against the Swiss Franc.
| USD | EUR | GBP | JPY | CAD | AUD | NZD | CHF | |
|---|---|---|---|---|---|---|---|---|
| USD | -0.10% | -0.09% | -0.03% | -0.06% | -0.18% | -0.04% | -0.02% | |
| EUR | 0.10% | 0.02% | 0.05% | 0.04% | -0.12% | 0.00% | 0.10% | |
| GBP | 0.09% | -0.02% | 0.06% | 0.06% | -0.13% | -0.01% | 0.08% | |
| JPY | 0.03% | -0.05% | -0.06% | -0.04% | -0.11% | -0.04% | 0.06% | |
| CAD | 0.06% | -0.04% | -0.06% | 0.04% | -0.13% | -0.09% | 0.05% | |
| AUD | 0.18% | 0.12% | 0.13% | 0.11% | 0.13% | 0.11% | 0.20% | |
| NZD | 0.04% | -0.01% | 0.01% | 0.04% | 0.09% | -0.11% | 0.09% | |
| CHF | 0.02% | -0.10% | -0.08% | -0.06% | -0.05% | -0.20% | -0.09% |
The heat map shows percentage changes of major currencies against each other. The base currency is picked from the left column, while the quote currency is picked from the top row. For example, if you pick the Australian Dollar from the left column and move along the horizontal line to the US Dollar, the percentage change displayed in the box will represent AUD (base)/USD (quote).
Australian Dollar FAQs
One of the most significant factors for the Australian Dollar (AUD) is the level of interest rates set by the Reserve Bank of Australia (RBA). Because Australia is a resource-rich country another key driver is the price of its biggest export, Iron Ore. The health of the Chinese economy, its largest trading partner, is a factor, as well as inflation in Australia, its growth rate and Trade Balance. Market sentiment – whether investors are taking on more risky assets (risk-on) or seeking safe-havens (risk-off) – is also a factor, with risk-on positive for AUD.
The Reserve Bank of Australia (RBA) influences the Australian Dollar (AUD) by setting the level of interest rates that Australian banks can lend to each other. This influences the level of interest rates in the economy as a whole. The main goal of the RBA is to maintain a stable inflation rate of 2-3% by adjusting interest rates up or down. Relatively high interest rates compared to other major central banks support the AUD, and the opposite for relatively low. The RBA can also use quantitative easing and tightening to influence credit conditions, with the former AUD-negative and the latter AUD-positive.
China is Australia’s largest trading partner so the health of the Chinese economy is a major influence on the value of the Australian Dollar (AUD). When the Chinese economy is doing well it purchases more raw materials, goods and services from Australia, lifting demand for the AUD, and pushing up its value. The opposite is the case when the Chinese economy is not growing as fast as expected. Positive or negative surprises in Chinese growth data, therefore, often have a direct impact on the Australian Dollar and its pairs.
Iron Ore is Australia’s largest export, accounting for $118 billion a year according to data from 2021, with China as its primary destination. The price of Iron Ore, therefore, can be a driver of the Australian Dollar. Generally, if the price of Iron Ore rises, AUD also goes up, as aggregate demand for the currency increases. The opposite is the case if the price of Iron Ore falls. Higher Iron Ore prices also tend to result in a greater likelihood of a positive Trade Balance for Australia, which is also positive of the AUD.
The Trade Balance, which is the difference between what a country earns from its exports versus what it pays for its imports, is another factor that can influence the value of the Australian Dollar. If Australia produces highly sought after exports, then its currency will gain in value purely from the surplus demand created from foreign buyers seeking to purchase its exports versus what it spends to purchase imports. Therefore, a positive net Trade Balance strengthens the AUD, with the opposite effect if the Trade Balance is negative.