Gold firm as Fed rate cut bets remain strong despite mixed US labor data
- Gold holds above $4,200 as markets maintain 85% odds of a Fed rate cut next week.
- US labor data is mixed, with layoffs surging while jobless claims hit the lowest level since 2022.
- Weak ADP data and forecasts boost Gold demand ahead of Friday’s Core PCE inflation release.
Gold (XAU/USD) registers modest gains on Thursday, even though the latest US jobs data indicates that the labor market remains resilient, though signs of cooling are emerging. High expectations that the Federal Reserve (Fed) will cut rates keep Bullion prices underpinned, with XAU/USD trading at $4,212, up 0.25% at the time of writing.
Mixed US labor data keeps rate-cut bets elevated, helping Bullion extend gains despite signs of a steady jobs market
Market mood is mixed after the latest release of US economic data showed the labor market is weakening, but not as fast as economists expected. The Challenger Jobs Cut report, along with the number of Americans filing for unemployment benefits, reported mixed readings. The former hit its highest level of firing for November since 2022, while jobless claims reached its lowest level since September 2022, when the print was 189K.
Expectations for a rate cut remain high, with odds standing at 85% for a quarter of a percentage point rate cut by the Fed at next week’s meeting.
Odds grew following a dismal ADP National Employment Change report on Wednesday, which showed that private companies slashed 32K jobs last month.
A Reuters poll revealed that economists are expecting a rate cut at the December meeting, which is bullish for Gold prices, which tend to benefit from low-interest-rate environments.
Ahead, traders are eyeing the release of the Fed’s preferred inflation gauge, the Core Personal Consumption Expenditures (PCE) Price Index for September.
Daily market movers: Bullion price clings to gain amid firm US Dollar
- The US Dollar Index (DXY), which tracks the American’s currency performance against other six, is virtually unchanged at 98.93.
- The US 10-year Treasury Note yield is up four basis points (bps) at 4.104%. US real yields, which correlate inversely to Gold prices, are also up four basis points, at 1.864%, capping Gold’s advance.
- Initial Jobless Claims for the week ending November 29 came at 191K, below estimates of 220,000 and a decrease from last week's upwardly revised figures from 216K to 218K. Continuing Claims for the week ending November 22 were 1.939 million, down from the previous week’s 1.943 million.
- Challenger, Gray & Christmas revealed that employers announced 71,321 job cuts in November, up 24% from last year’s figures, but down 53% from the print announced in October this year.
- The World Gold Council (WGC) revealed that central banks bought 53 tons of the yellow metal in October, the strongest month year-to-date . Krishan Gopaul, Senior Analyst, EMEA at the WGC, said, “Central bank demand for gold remained robust in October, totaling 53t (+36% m/m) and continuing the strong trend seen throughout the year.”
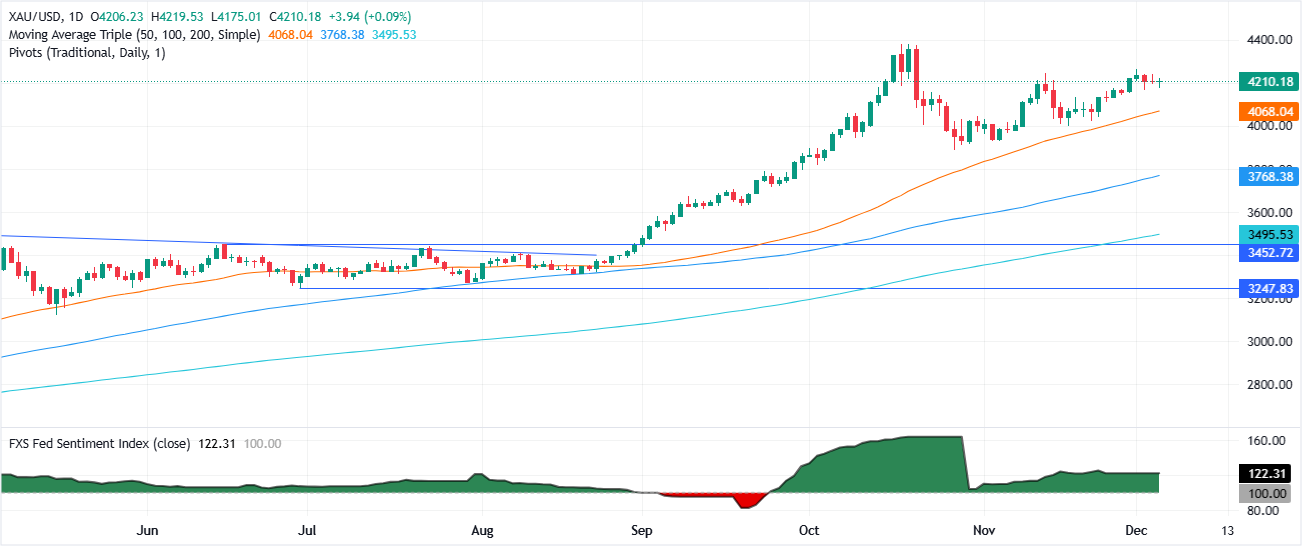
Technical Analysis: Gold remains near $4,200 waiting for US Core PCE
Gold remains upwardly biased and the daily close above $4,200 paved the way for higher prices. The Relative Strength Index (RSI) is still bullish but has flattened somewhat, suggesting consolidation as traders await a new catalyst.
If XAU/USD breaks above $4,250, it could attempt to reach $4,300, with the record high of $4,381 as the next target. On the other hand, if Gold drops beneath $4,200, the following support level is the 20-day Simple Moving Average (SMA) at $4,124, then $4,100 ahead of the 50-day SMA at $4,059.
Gold FAQs
Gold has played a key role in human’s history as it has been widely used as a store of value and medium of exchange. Currently, apart from its shine and usage for jewelry, the precious metal is widely seen as a safe-haven asset, meaning that it is considered a good investment during turbulent times. Gold is also widely seen as a hedge against inflation and against depreciating currencies as it doesn’t rely on any specific issuer or government.
Central banks are the biggest Gold holders. In their aim to support their currencies in turbulent times, central banks tend to diversify their reserves and buy Gold to improve the perceived strength of the economy and the currency. High Gold reserves can be a source of trust for a country’s solvency. Central banks added 1,136 tonnes of Gold worth around $70 billion to their reserves in 2022, according to data from the World Gold Council. This is the highest yearly purchase since records began. Central banks from emerging economies such as China, India and Turkey are quickly increasing their Gold reserves.
Gold has an inverse correlation with the US Dollar and US Treasuries, which are both major reserve and safe-haven assets. When the Dollar depreciates, Gold tends to rise, enabling investors and central banks to diversify their assets in turbulent times. Gold is also inversely correlated with risk assets. A rally in the stock market tends to weaken Gold price, while sell-offs in riskier markets tend to favor the precious metal.
The price can move due to a wide range of factors. Geopolitical instability or fears of a deep recession can quickly make Gold price escalate due to its safe-haven status. As a yield-less asset, Gold tends to rise with lower interest rates, while higher cost of money usually weighs down on the yellow metal. Still, most moves depend on how the US Dollar (USD) behaves as the asset is priced in dollars (XAU/USD). A strong Dollar tends to keep the price of Gold controlled, whereas a weaker Dollar is likely to push Gold prices up.