Gold steadies on softer USD, lower yields and easing inflation fears
- Gold trades firm on Tuesday as a softer US Dollar and lower Treasury yields provide support.
- Falling Oil prices ease inflation concerns, keeping Fed rate-cut expectations in focus.
- Technically, XAU/USD holds above key support near $5,100, while $5,200 continues to cap the upside.
Gold (XAU/USD) trades on a firm note on Tuesday, building on the previous day’s rebound from levels near $5,000. The precious metal is drawing support from a softer US Dollar (USD) and subdued Treasury yields, while the ongoing US-Iran war keeps market sentiment cautious and continues to cushion the downside.
At the time of writing, XAU/USD is trading around $5,167, up nearly 0.55% on the day, with sellers defending the $5,200 level.
War headlines drive sharp moves in Oil and global risk sentiment
Markets digested conflicting headlines around the US-Iran war. CBS reported on Monday that US President Donald Trump said, “I think the war is very complete, pretty much,” adding that the US was “very far ahead of schedule.”
Trump also turned his attention to Oil prices, saying the US could waive some oil-related sanctions and deploy the United States Navy to escort commercial tankers through the Strait of Hormuz. “We’re looking to keep the oil prices down,” Trump said. “They went artificially up because of this excursion.”
However, Iran’s Islamic Revolutionary Guard Corps (IRGC) said overnight that “it is we who will determine the end of the war,” and warned ships against passing through the Strait of Hormuz.
Trump’s comments, along with reports that G7 countries are discussing a coordinated release of Oil reserves through the International Energy Agency (IEA), lifted market sentiment, triggering a sharp pullback in Oil prices while global equities rebounded.
Still, tensions around the Strait of Hormuz remain elevated as the conflict enters its eleventh day, with airstrikes continuing across the Middle East.
Fed rate-cut bets remain in focus
The drop in Oil prices – WTI and Brent dropped 5.84% and 3.69% respectively on Monday – eased global inflation concerns, allowing the USD and Treasury yields to pull back from recent highs as traders continued to price in Federal Reserve (Fed) interest rate cuts in the second half of the year.
According to the CME FedWatch Tool, markets see a 57.2% probability that the Fed will deliver its first rate cut of 2026 in July, while the chances of a cut in June stand at around 40.8%.
Looking ahead, a light US economic calendar is likely to keep traders focused on geopolitical developments. The ADP Employment Change 4-week average is the only notable data release on the docket, with attention squarely on the Consumer Price Index (CPI) figures due on Wednesday and the Personal Consumption Expenditures (PCE) Price Index report on Friday.
Technical analysis: XAU/USD trades sideways as RSI cools and trend strength weakens
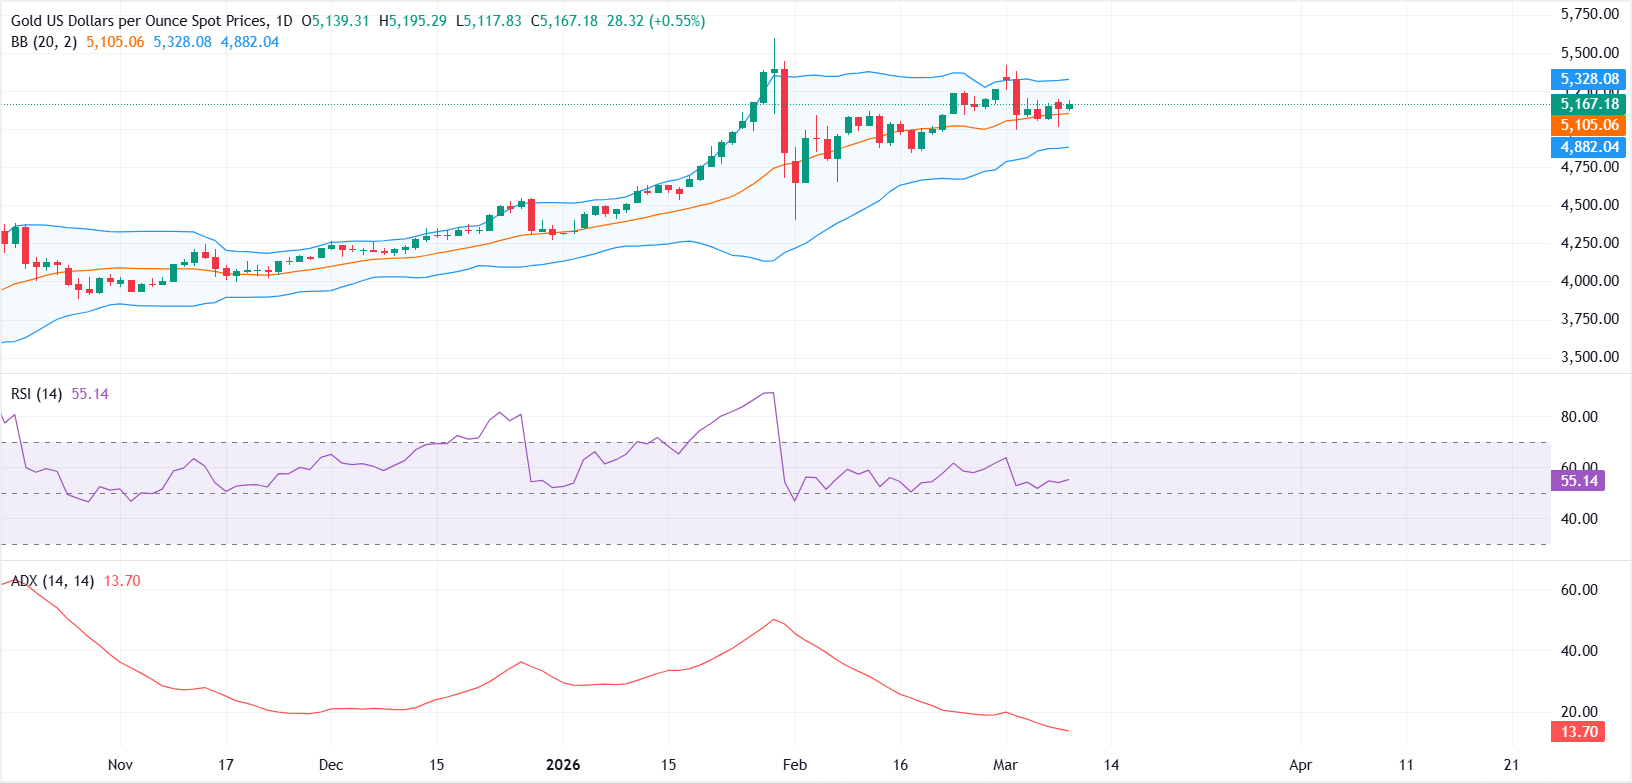
XAU/USD is consolidating within a familiar $5,000-$5,200 range. On the daily chart, the short-term bias remains mildly bullish, with price stabilising above the 20-day Bollinger Band middle line near $5,105, which is acting as immediate support. A sustained break below this zone could trigger a deeper pullback toward the lower Bollinger Band near $4,880.
On the upside, $5,200 remains the key resistance level, and a decisive daily close above this barrier could open the door for a move toward the upper Bollinger Band around $5,330.
Momentum indicators offer a mixed signal on the daily chart. The Relative Strength Index (RSI) has stabilised above the 50 level, after easing from overbought territory, suggesting bullish momentum is cooling but still intact. Meanwhile, the Average Directional Index (ADX) near 14 indicates weak trend strength, reinforcing the view that XAU/USD may remain range-bound in the near term.
Gold FAQs
Gold has played a key role in human’s history as it has been widely used as a store of value and medium of exchange. Currently, apart from its shine and usage for jewelry, the precious metal is widely seen as a safe-haven asset, meaning that it is considered a good investment during turbulent times. Gold is also widely seen as a hedge against inflation and against depreciating currencies as it doesn’t rely on any specific issuer or government.
Central banks are the biggest Gold holders. In their aim to support their currencies in turbulent times, central banks tend to diversify their reserves and buy Gold to improve the perceived strength of the economy and the currency. High Gold reserves can be a source of trust for a country’s solvency. Central banks added 1,136 tonnes of Gold worth around $70 billion to their reserves in 2022, according to data from the World Gold Council. This is the highest yearly purchase since records began. Central banks from emerging economies such as China, India and Turkey are quickly increasing their Gold reserves.
Gold has an inverse correlation with the US Dollar and US Treasuries, which are both major reserve and safe-haven assets. When the Dollar depreciates, Gold tends to rise, enabling investors and central banks to diversify their assets in turbulent times. Gold is also inversely correlated with risk assets. A rally in the stock market tends to weaken Gold price, while sell-offs in riskier markets tend to favor the precious metal.
The price can move due to a wide range of factors. Geopolitical instability or fears of a deep recession can quickly make Gold price escalate due to its safe-haven status. As a yield-less asset, Gold tends to rise with lower interest rates, while higher cost of money usually weighs down on the yellow metal. Still, most moves depend on how the US Dollar (USD) behaves as the asset is priced in dollars (XAU/USD). A strong Dollar tends to keep the price of Gold controlled, whereas a weaker Dollar is likely to push Gold prices up.